Gesher Galicia Interactive Data Maps Project

The project is the result of a multi-year collaboration between Gesher Galicia and skilled genealogists working individually or as part of historical research groups focused on specific towns in Galicia. More information is given below about what is presented in the data maps, how to use them, and the origins of the project.
Data Maps
The maps linked here are the result of the pilot phase of the Data Maps Project:
Summary of the Project Elements
Each of the data maps in this project brings together three kinds of data:
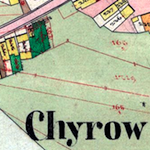
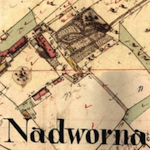
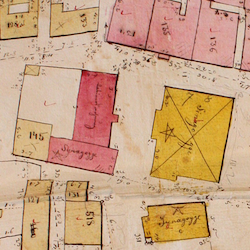
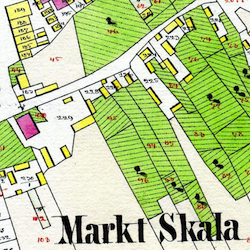
- a historical cadastral (property) map of one village, town, or city in Galicia; and
- a current aerial view of the same settlement via modern internet mapping services; and
- a collection of indexed historical records data for people, places, and other aspects of life in the historical place

Modern aerial (satellite) images of former Galician villages, towns, and cities from web mapping services are shown here as a background onto which the historical map is scaled and aligned, using persistent natural and manmade features such as rivers, roads, and significant buildings which have survived largely unchanged over one to two hundred years. The Bing web mapping service (part of a Microsoft service framework) was used in the pilot project due to the high quality of aerial images covering former Galicia and because of relatively simple use rules for non-commercial purposes. The opacity of the historical map layer can be varied using a slider in the map window to reveal the modern settlement below, which enables locating past buildings and more in the modern place, and also permits a visual evaluation of stability and change in the settlement during the many years since the place was surveyed for the map.

The data map then uses JavaScript programming elements to import the tabulated geographical and records data and place color-coded dots at identified locations on both the historical map and the satellite image base layer. Each dot can be clicked to reveal historical records data associated with a place, and the entire data set can be searched for matching information such as a name or house number. Searches can be broad or narrowed by category such as family event (birth, marriage, death), property ownership, year, etc. While browsing the map or searching and studying, the map can be panned and zoomed to focus the area of study. The following section describes using the data maps in more detail.
How to Use the Data Maps

- panning: Moving the map left, right, up, and down within the view window is simple, with click-drag or press-drag movements as for other internet maps. Click and hold the left button on a mouse, or press and hold on a trackpad or touchscreen, then move your cursor around to reposition the map.
- zooming: You can zoom in or out on the map by clicking on the + and – buttons at the upper right of the view window, or on many devices by double-clicking on the map to zoom in, and double-clicking with the Shift key held down to zoom out.
- map opacity: At the upper right of the map view window there is an opacity slider bar which can be adjusted to show the historical map at 100% opacity (bar set to the right), or 0% opacity (fully transparent, bar set to the left), or at any opacity level in between.

- blue dots: Private residential and/or commercial buildings (homes and businesses). By far the majority of marked places on the historical maps are blue-dot private buildings.
- green dots: Civil or religious community buildings. These may include synagogues, ritual baths, schools, hospitals, burial houses, and other Jewish community buildings; churches, parish halls, schools, hospitals, and other Christian community buildings; local administration buildings such as town halls, civil schools and hospitals, etc.; and Austro-Hungarian imperial structures such as military barracks, customs houses, riding schools; and more.
- orange dots: Civil or religious community land parcels. Typically this means cemeteries (Jewish, Christian, or municipal), but other community land may be marked also.
- black dots: Buildings visible and numbered on the historical map, but which lack available records data (this is typically not used).
- white dots: Land parcels visible and numbered on the historical map, but which lack available records data (this is typically not used).

In many cases the records window can be large, and will cover areas of the historical map which may be important to the researcher. The records window can be click-dragged around the map view window to reveal other areas of the map, or (when there are many records linked to the selected place) more of the records list. If you wish to copy part of the records data for pasting into another application, you can click the "Drag" button at the upper left corner of the records window to turn off dragging and fix the window in place, and then highlight sections of records text to copy. Releasing the records window so it can be dragged again is also easy: just click the "Drag" button at the upper left corner to return to the normal "On" mode. The records window can be cleared by clicking the X at the upper right corner of the window, or by clicking a different dot on the map to select another location.

Clicking the "Search category ▼" button reveals more than a dozen filters which can be applied to search terms to narrow the returned results of the search. You can select more than one simultaneous search category. Clicking a selected category again will clear it, and you can clear all selections by clicking "All" twice. As for any search engine, trying different search terms and filters can help find the results you are looking for.
The results of a search are listed in a box below the search bar; if no matching records are found in the linked data, the results box says "NO MATCHES". Matching records are reported as hyperlinks to locations on the historical map. Clicking any listed record centers the map in the view window on the dot which represents the location of the data, enlarges the dot to highlight it on the map, and attaches all of the linked data for that location to a pop-up window for review.
An important note: Sometimes the search results can seem confusing, because the search tool cannot intuit what the records mean – it only reports what is listed in the records data, so users must explore and analyze the data themselves to understand the meaning. Normally, a search for a surname will return every mention of that name in the data, tied to the houses where the records were documented and the types of records where the name appears. But sometimes (and for some kinds of records, often) the record type and the discovered surname don't seem to match. Even so, clicking on the house number link in the search results will usually explain how the data does in fact match.

If you are looking closely, you will also see that the Krentner family had been associated with house # 64 in Skała for at least six decades. The name is noted in records beginning in 1828 as Kraytner, Krantner, Kreuntner, and Krentner, all normal variants of the name as was common in Galician records for more than a century.
A brief illustrated example (below) may help explain the search, click, and discovery process, but users are encouraged to experiment with any map which interests them. If at any time you get "lost" in the map or in a search effort, you can restart simply by refreshing the map page with your browser controls, which will clear all settings and selections and recenter the map zoomed out to the overview.
A Search and Discovery Example

- What Glanzbergs are listed in Rohatyn records data?
- Where did they live in Rohatyn?
- Who else lived at those same locations, or nearby, who may be related?
In the first screenshot below, the search category of "Surname" has been selected, and the name "Glanzberg" has been entered as a search term. Clicking the Search button gives the results listed in the box below the search tool. The results include property records, vital (metrical) records, and voter records, all linked to locations on the historical map. The notation "H#" represents house numbers, and "BP#" represents building parcel (property tax ID) numbers; on this field sketch map, building parcel numbers are not shown, but a property register acquired by Gesher Galicia includes the data which links house numbers to building parcel numbers for the 1846 survey year, and that data is linked to this map.

The blue house numbers and building numbers in the search results box above are hyperlinks; clicking any one will focus the map on the selected location. In the second screenshot below, the first entry in the search results has been clicked, centering the map on house 45 in Rohatyn. Anker Glanzberg is listed as the house owner in 1846, but other records tied to the place suggest that Glanzberg families may have owned house 45 for only one generation, or less.

What about other Glanzbergs; where did they live? Clicking the different search results hyperlinks shows that Glanzberg families lived in several houses not far from each other on the west side of the market square in Rohatyn; two of the houses were in fact next door to each other. Clicking the dots on nearby houses reveals who the Glanzbergs' neighbors were at different points in time. As seen, the chronological listing of records data also gives clues to the mobility of families in this town across the span of time which the linked records cover.
Other searches will lead to different kinds of discoveries, and as for any genealogical research, also to new questions and puzzles. By focusing on place as a research tool, the data maps can create new avenues of research, and give a perspective not available from text records alone.
About the Project

Unfortunately, Pamela passed away before her dream of integrating many types of family records with cadastral maps could be realized, mostly due to technical limitations within Gesher Galicia's research budget. In a partnership between her family, individual donors, and Gesher Galicia, the Pamela Weisberger Memorial Fund was created to fund projects in her memory, particularly those in which she had a special interest. Software development for the Gesher Galicia Data Maps Project was one of the first initiatives to be funded to support contract specialists and volunteers through a pilot phase of four data maps.
The data maps project builds on ongoing relationships between Gesher Galicia and historical archives in Poland and Ukraine, as well as the Map Room's current preparation and assembly processes for scanned original archival cadastral map sheets, including many of the software tools which create the Map Room functionality plus some specially created to search and present data on the maps:
- map stitching and color correction: Adobe Photoshop Elements and the open-source GIMP
- map tiling and base viewer: MapTiler
- map tile layering and display: OpenLayers
- records data assembly: Microsoft Excel and other spreadsheet programs
- data importing, sorting, and searching: JavaScript and JQuery libraries
The following people worked through the development and pilot phases of the data maps project, either as contractors (programming) or as volunteers (programming and all else):
- JavaScript programming and data handling: Vasyl Yuzyshyn
- project coordination and map assembly: Jay Osborn
- pilot phase town data researchers, in alphabetical order: Alex Feller, Rob Garber, Tony Hausner, Max Heffler, Racheli Kreisberg, Russ Maurer, Jay Osborn, Steven Turner
See the individual map project pages (linked in the data map descriptions) for more information about the specific graphical and text data in each map, known issues, and the town research team which created the linked data for each map.