Although many types of maps are useful to genealogists studying Galicia, cadastral maps are particularly valuable because house numbers are often cited in vital records (where people were born, where they lived when they died, etc.), and because associated tax lists often provide a near-complete survey of a town's land and building capital and owners. Relationships between individuals and families, and business and religious associations can often be clarified or confirmed by researching neighborhoods and market areas via building and parcel numbers on the maps. Where cadastral maps and records exist for more than one survey year, changes in families and communities can be analyzed across time.
A series of cadastral land surveys, valuations, and mappings were made throughout the Austrian Empire in the 18th and 19th centuries, with the purpose of making property taxation more equitable (based on accurate measures of land, crops, and improvements). The third major edition of these, the so-called Stabile Cadastre begun under Emperor Franz II/I, was conducted from 1817 to 1861; Galicia was surveyed progressively from west to east, beginning in 1824 for a period of 30 years. Property in and around towns was measured as part of a "land cadastral community" (or just cadastral community); often the cadastral and political boundaries of a town were the same, but large towns could be broken into smaller cadastral communities, and adjacent smaller towns and villages were sometimes aggregated into single cadastral communities.
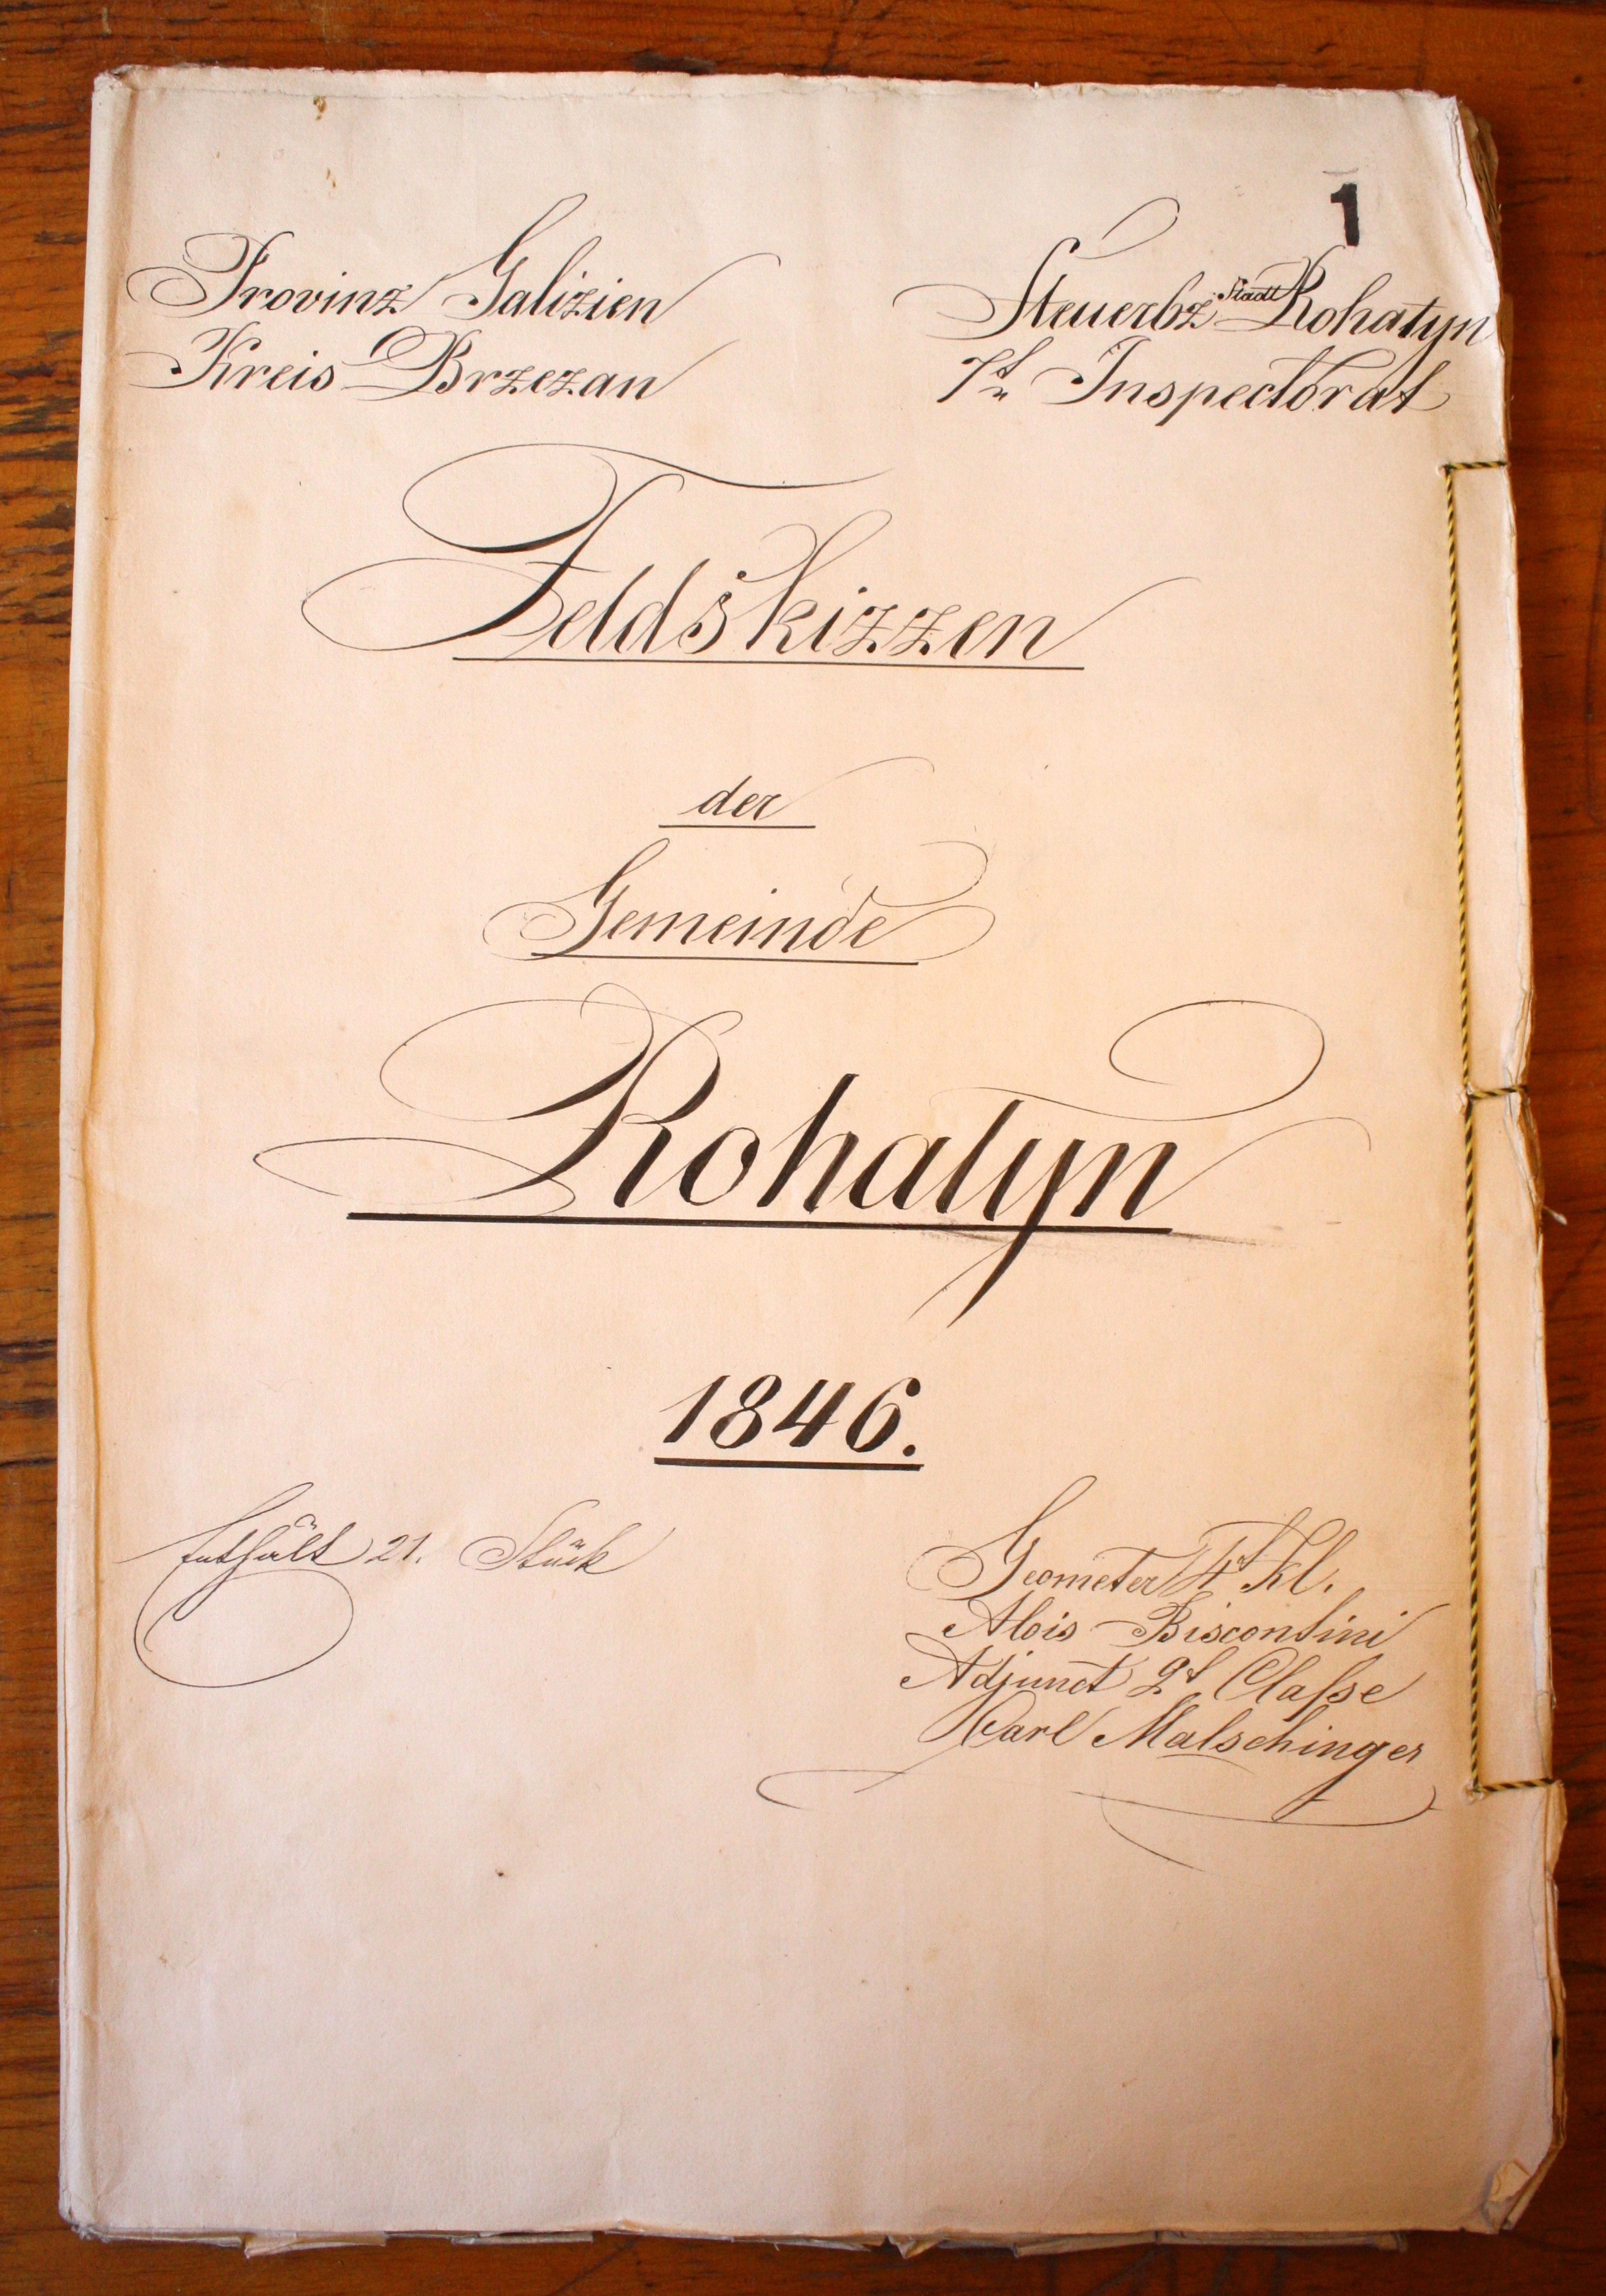
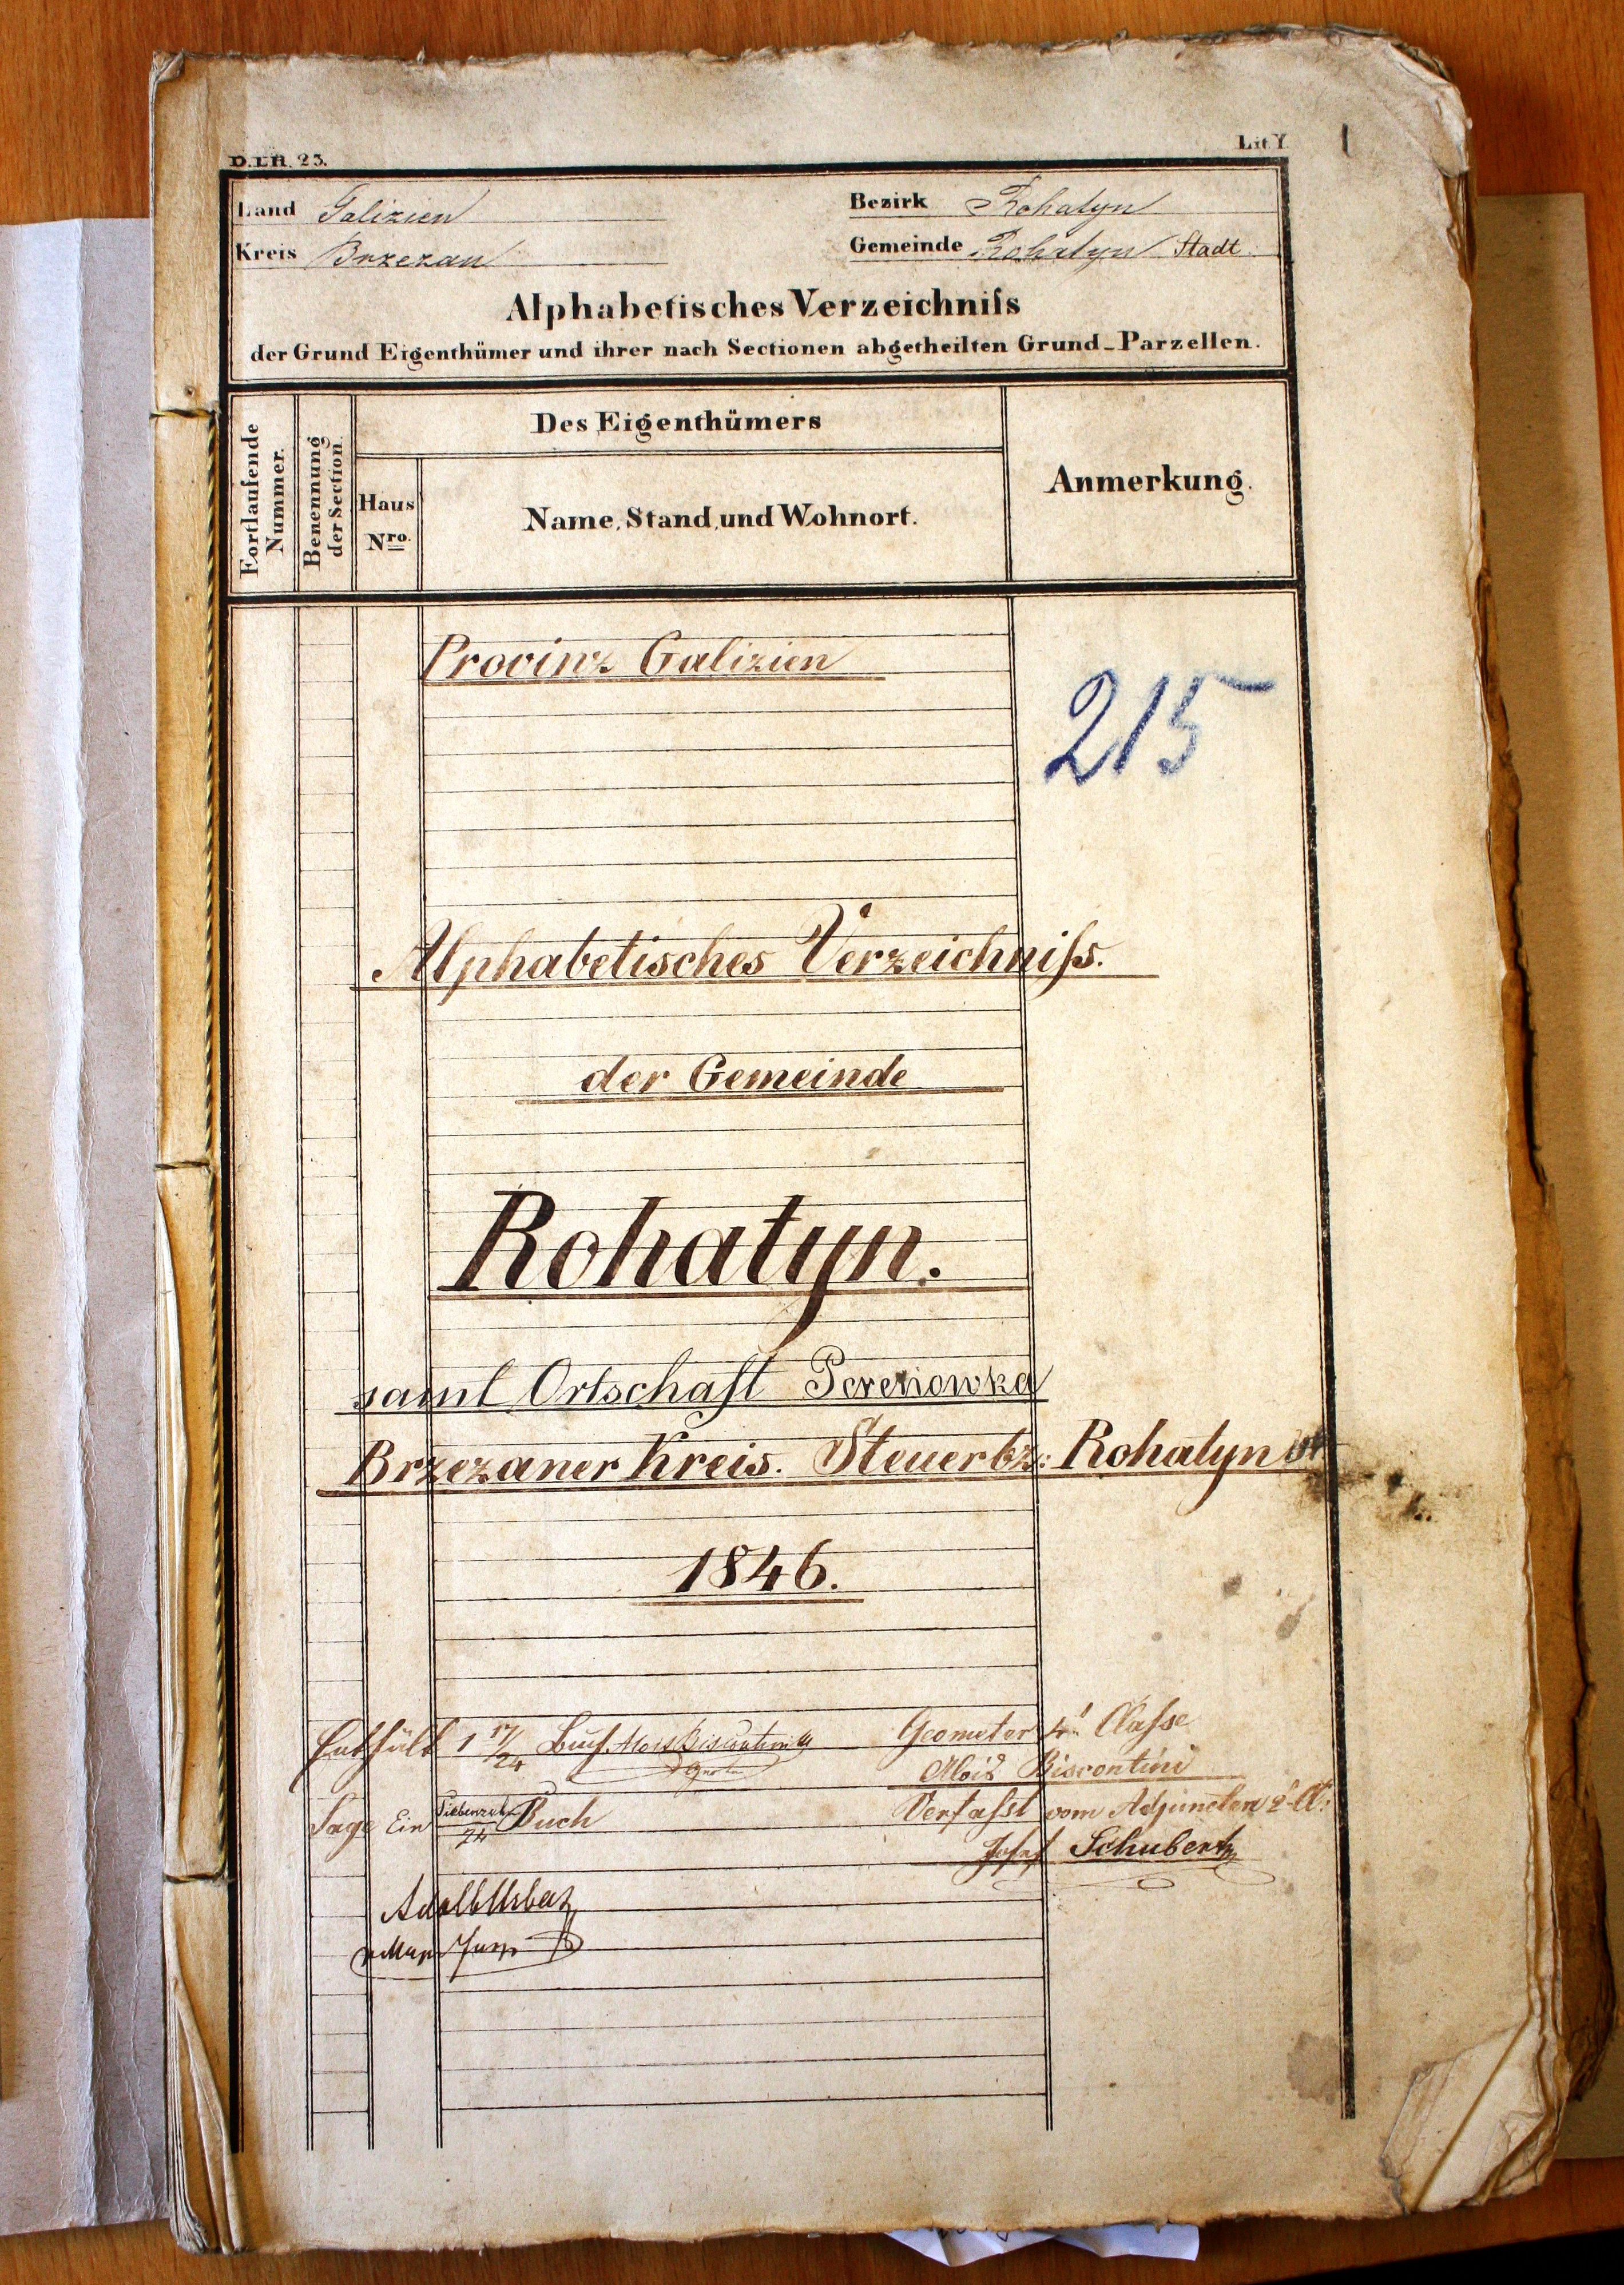
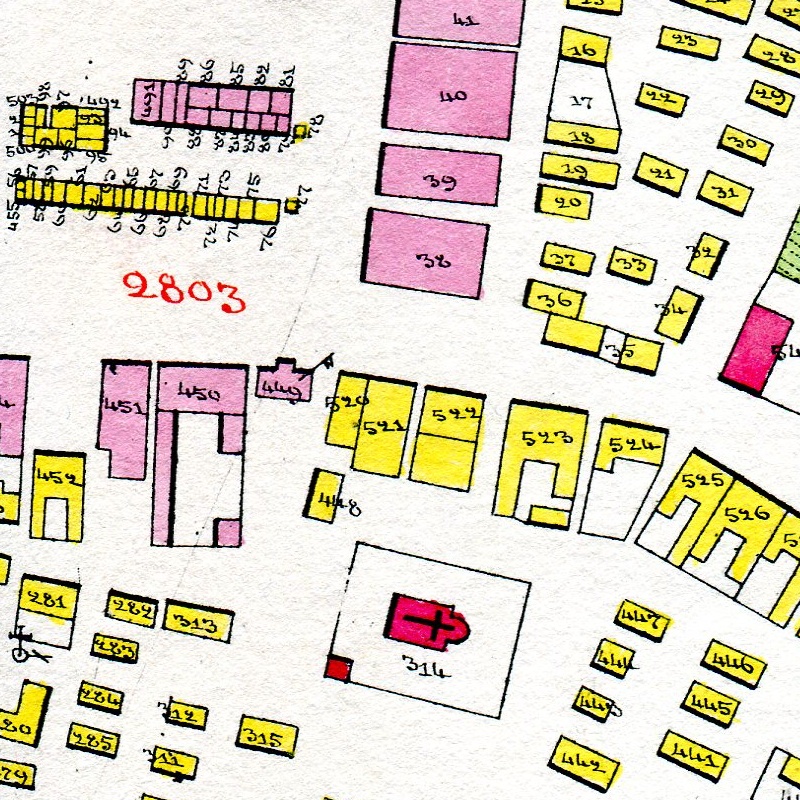
The overall imperial survey effort was massive: the land survey area (including the Kingdom of Hungary) measured almost 700,000 square kilometers, and included 30,000 cadastral communities; about 50 million properties were recorded on over 160,000 map sheets (one source counts 40,000 map sheets for Galicia alone). The survey was documented with remarkable precision and accuracy in sets of cadastral maps and associated property owner record books; only a fraction of those records for Galicia survive in archives today. Examples of the map and property owner record sets for Rohatyn, from 1846, are shown here; the map contains 20 sheets, and the property list approximately 150 pages:
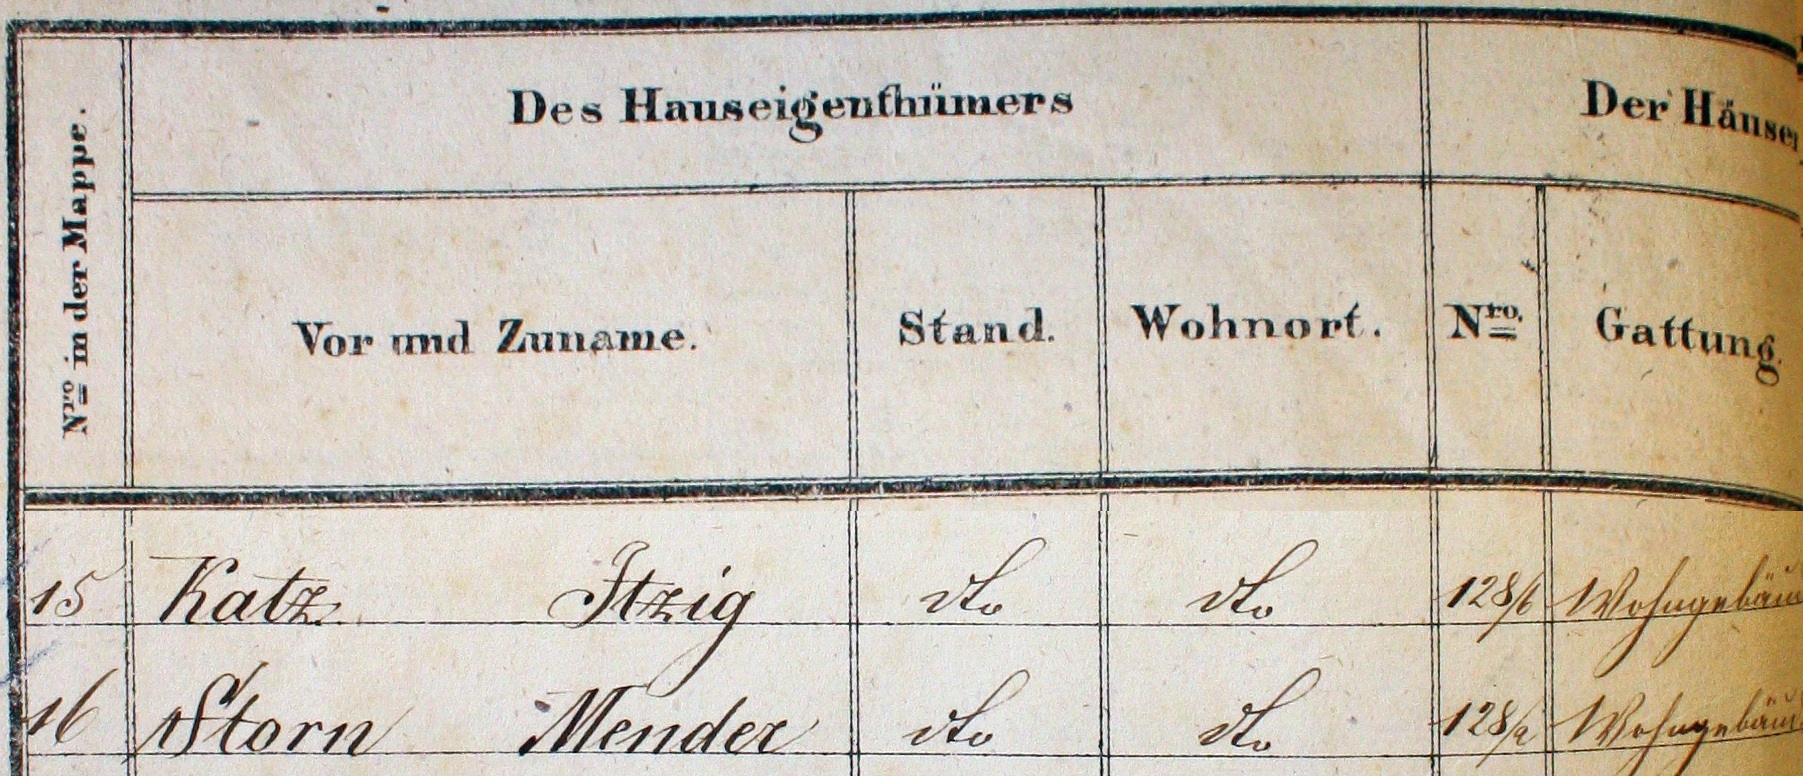
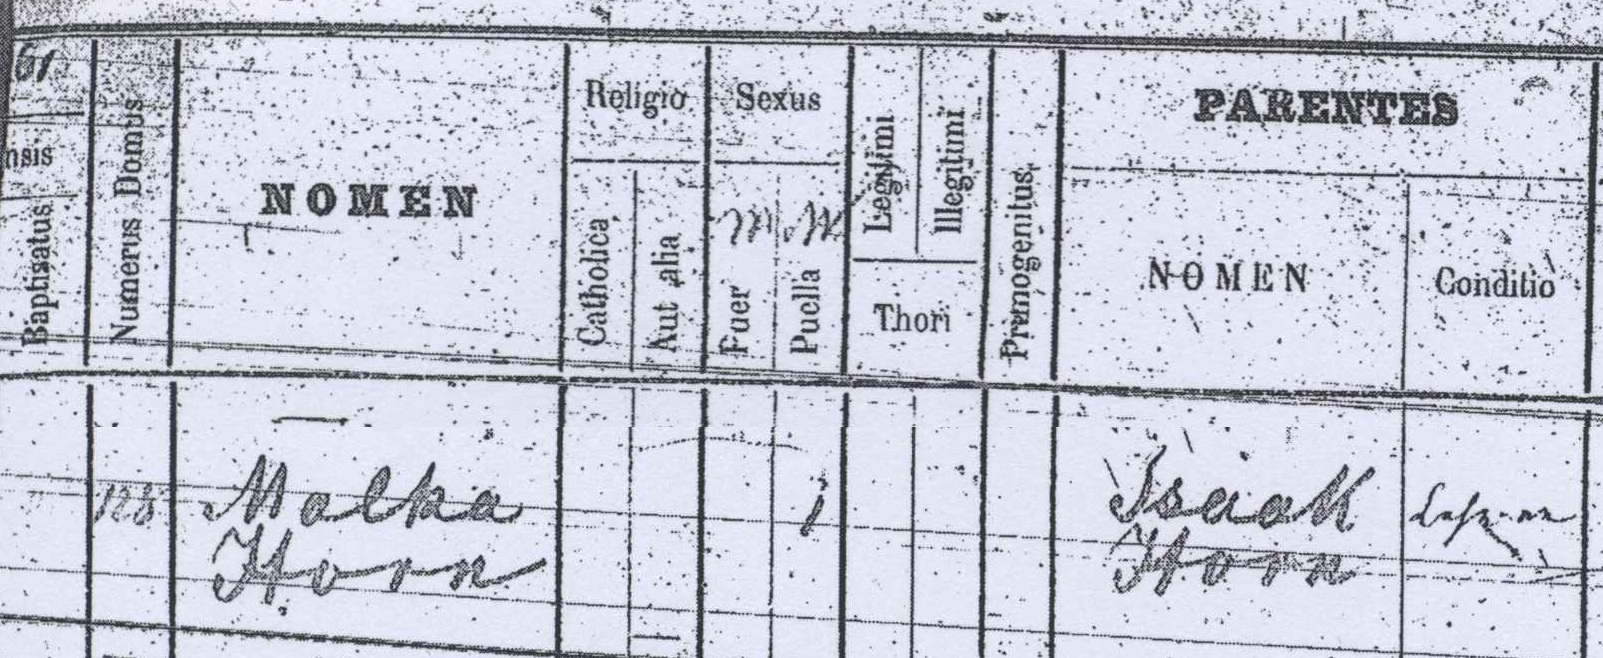
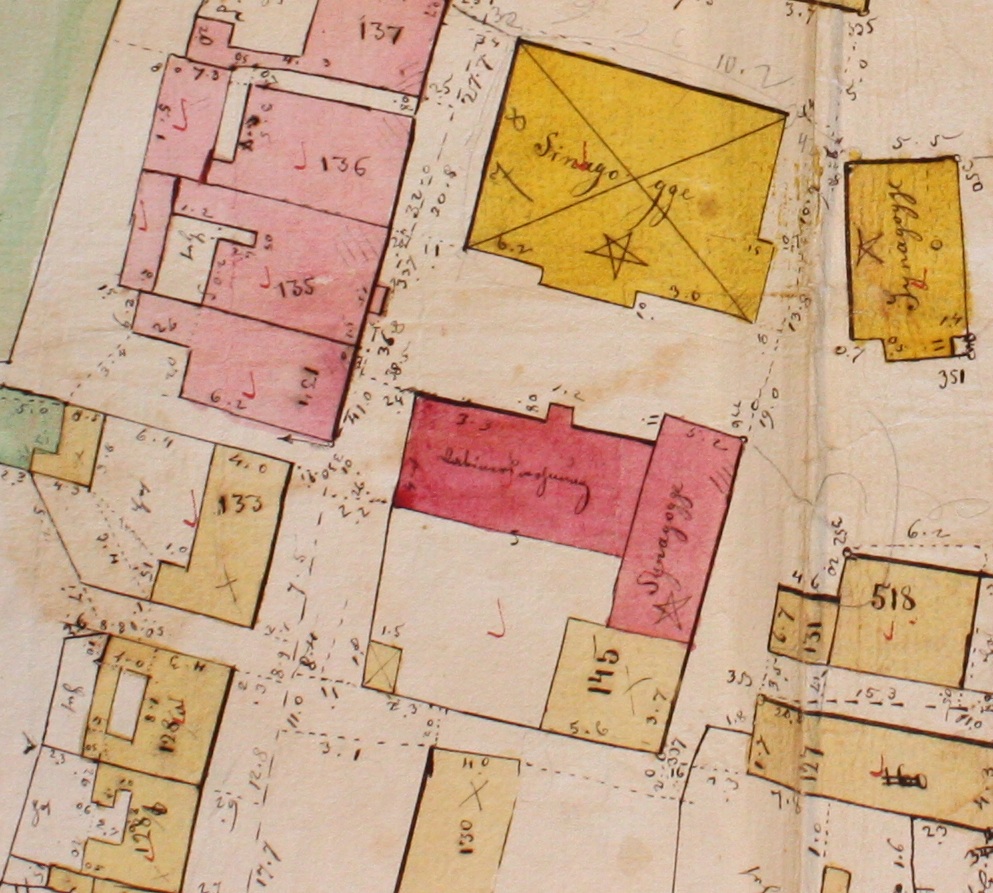
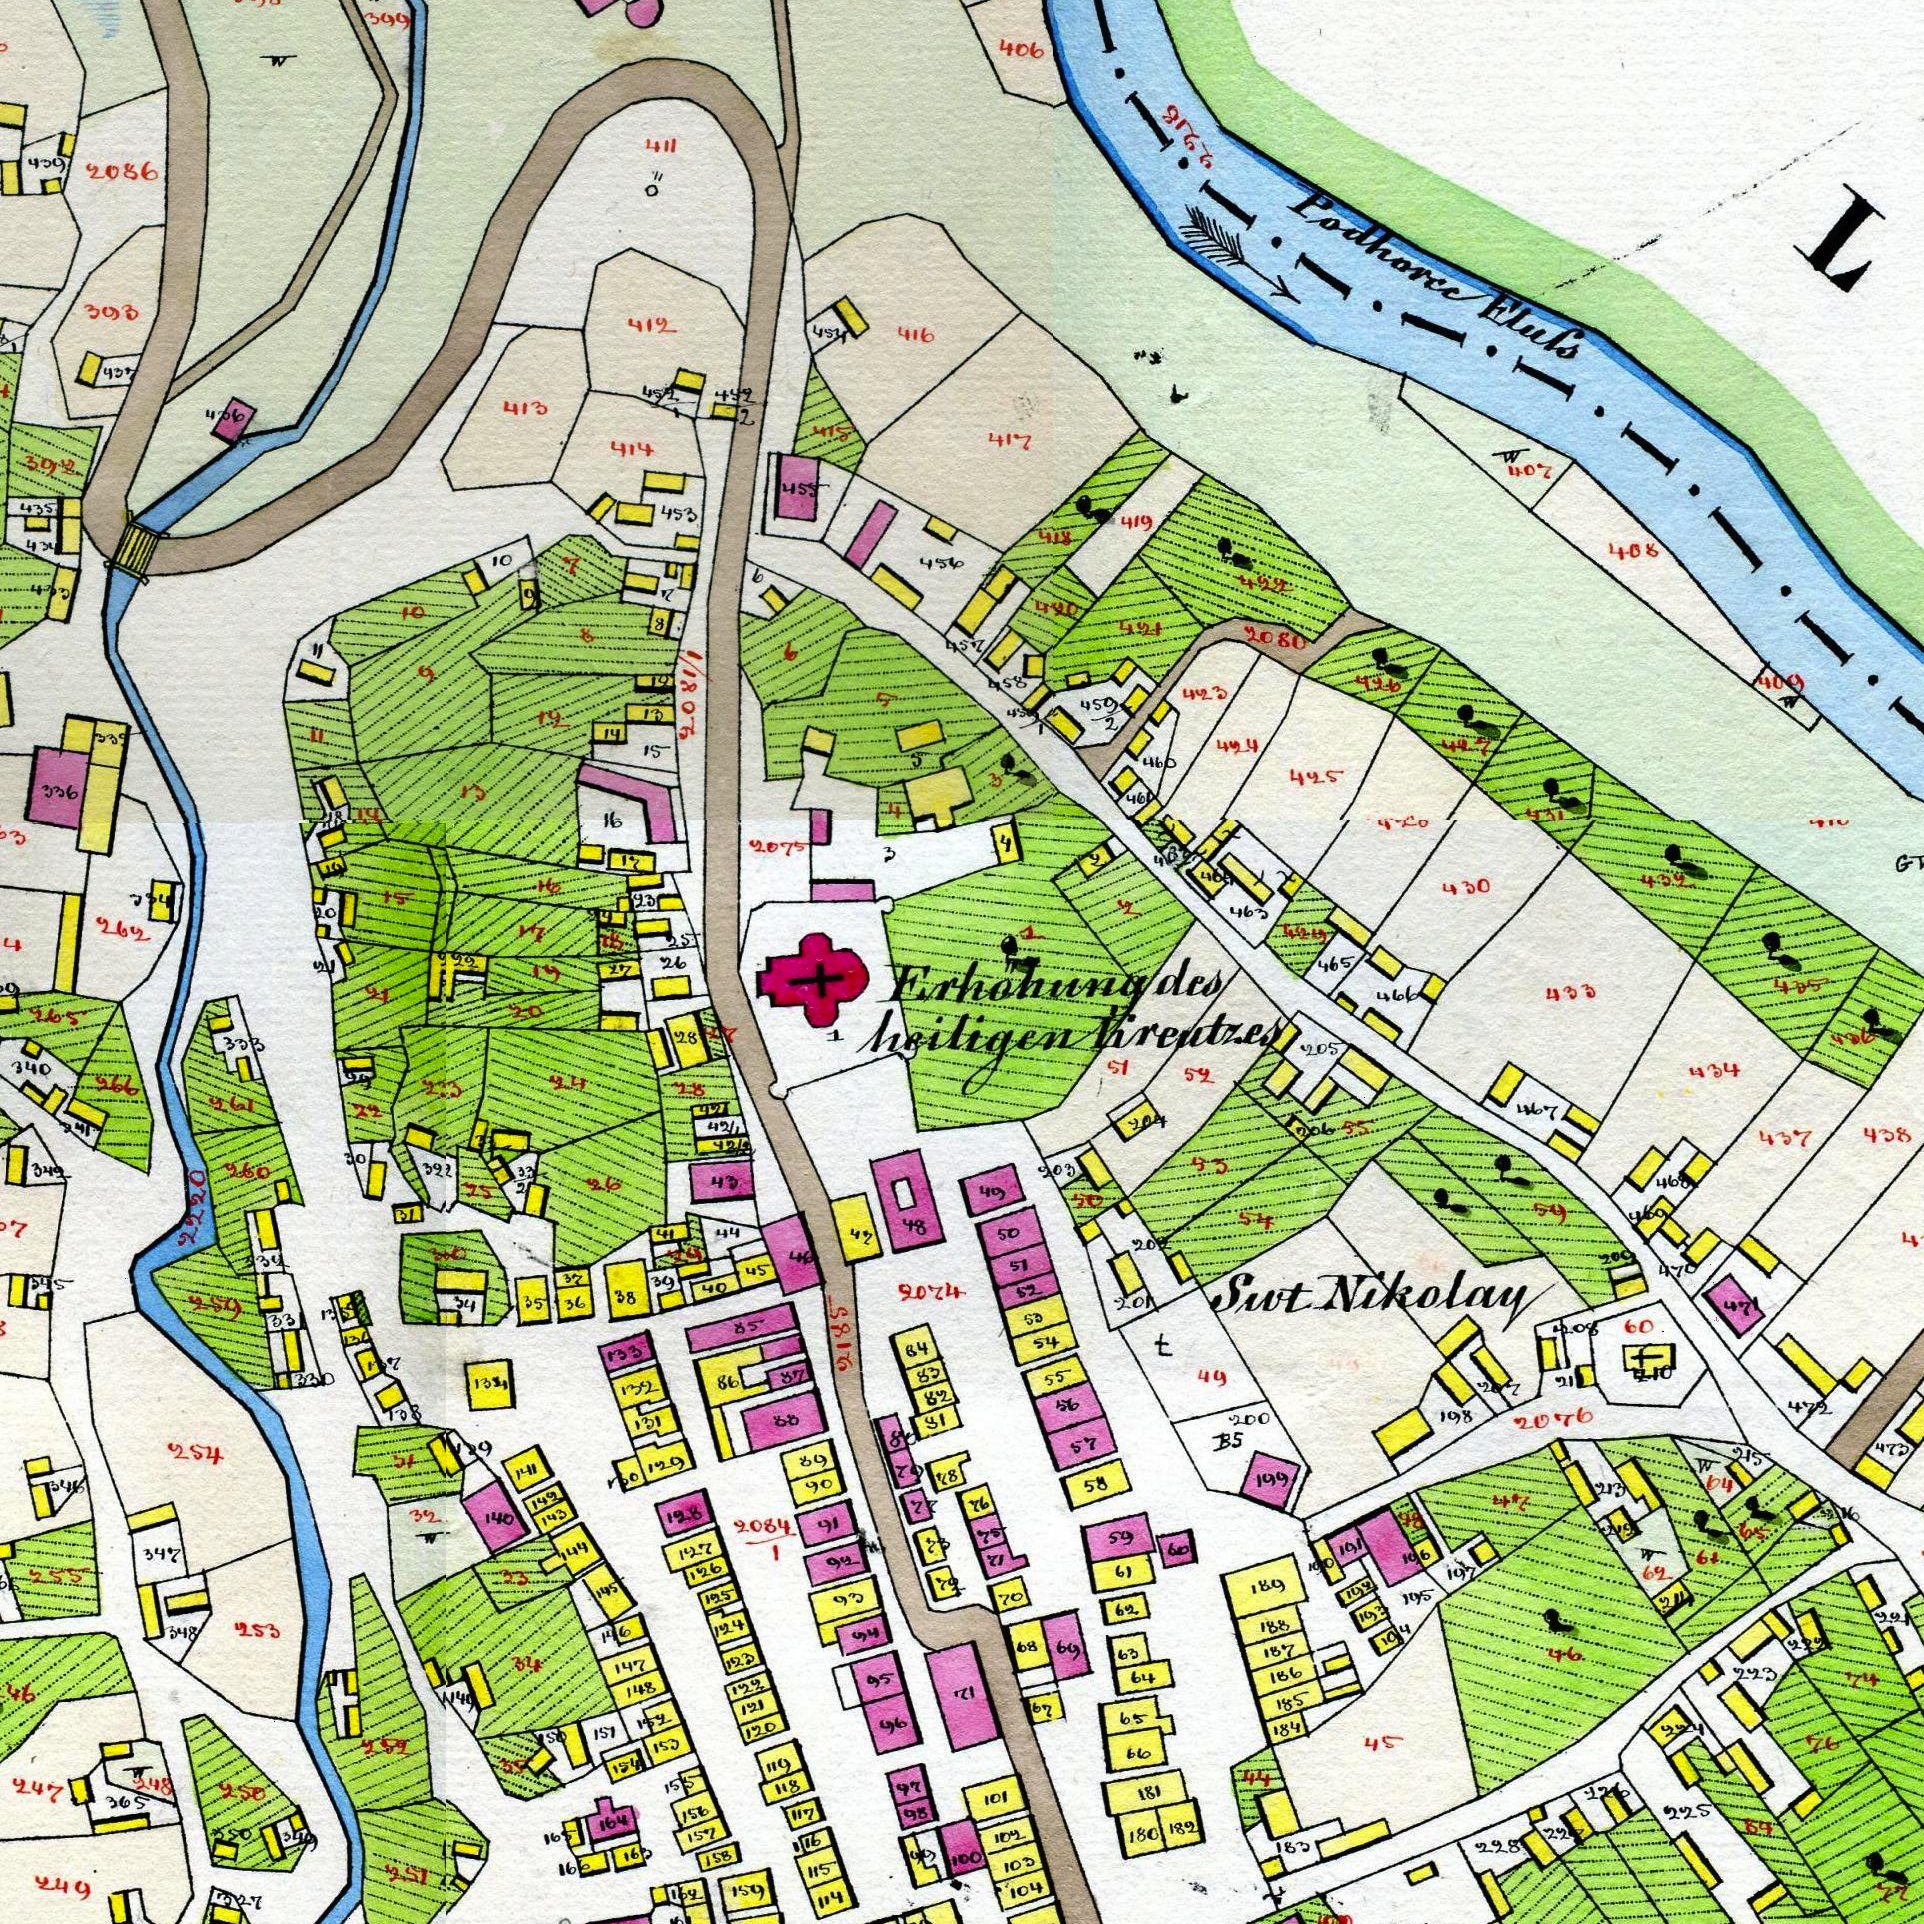
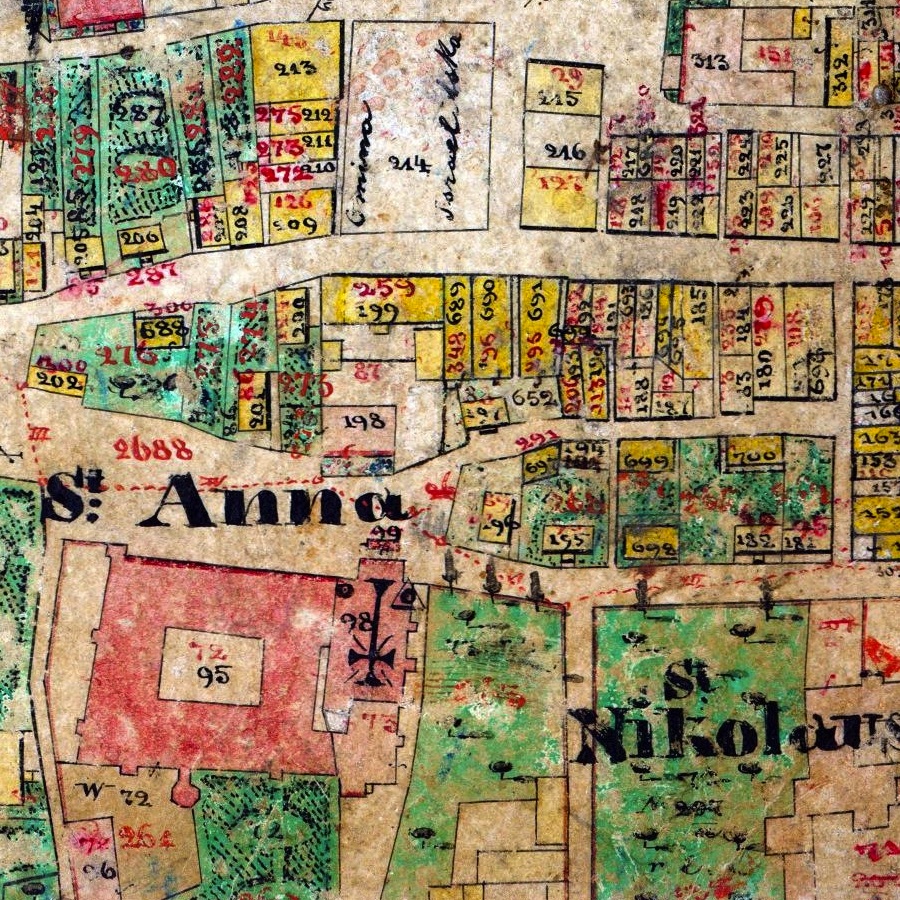
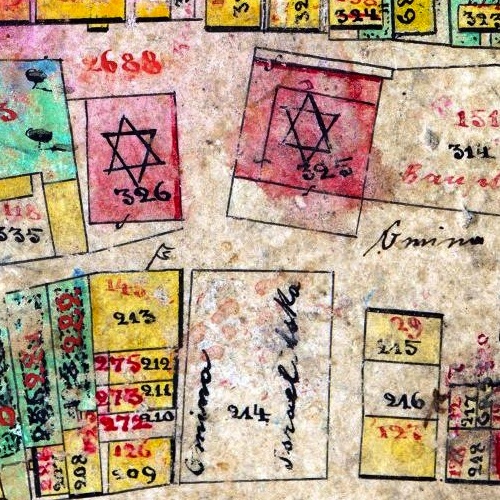
Within these records are many examples of the link between people and places. On one of the pages of the 1820 Rohatyn property owners list (for which no corresponding cadastral map exists), a Mendel Horn is listed as owner/resident of house number 128; he is shown again in house 128a on the 1846 property owners list as "Mender Storn". In vital record books for Rohatyn, an 1861 birth index listing for Malka Horn shows her father Isaak Horn as living in house number 128. In the 1846 Rohatyn feldskizzen, sheet 10 of the map shows a dense grouping of houses surrounding a number of synagogues, indicating a Jewish area of the town; houses 128a and 128b are visible in the lower left corner of this image.

Maintenance (correction and updating) of the Empire's set of cadastral surveys proved difficult, but laws were enacted in the 1880s and later to ensure that the maps and records would be updated in harmony with the actual and legal state of the landscape. After the breakup of the Empire (and Galicia) into separate states in 1918, cadastral surveys continued to be recorded; in many of the states even today, the Stabile Cadastre serves as a historical reference for current federal property law, land management, and environmental analysis.
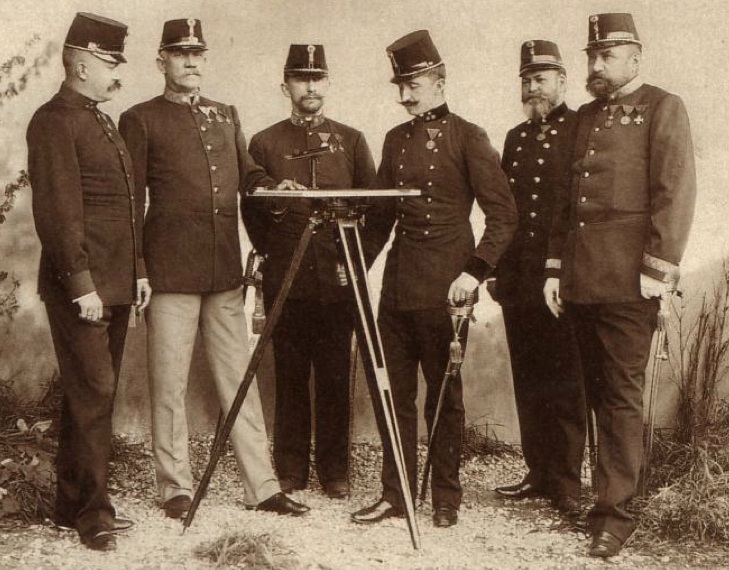
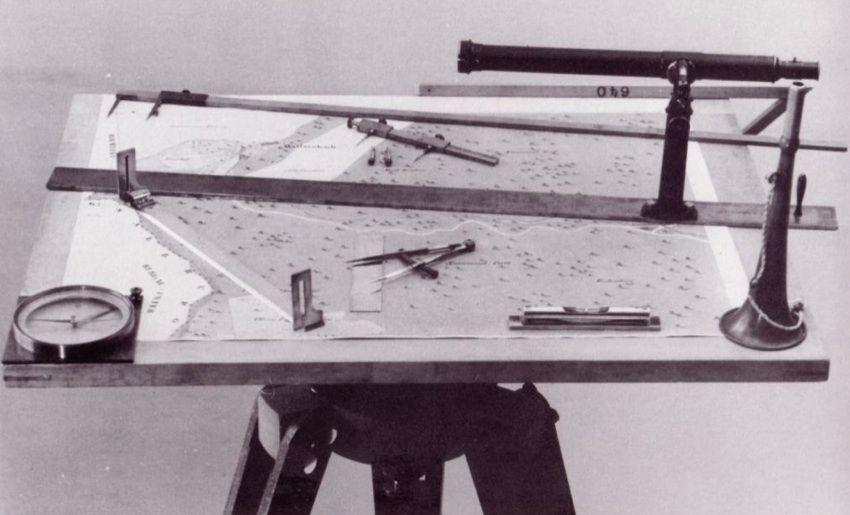
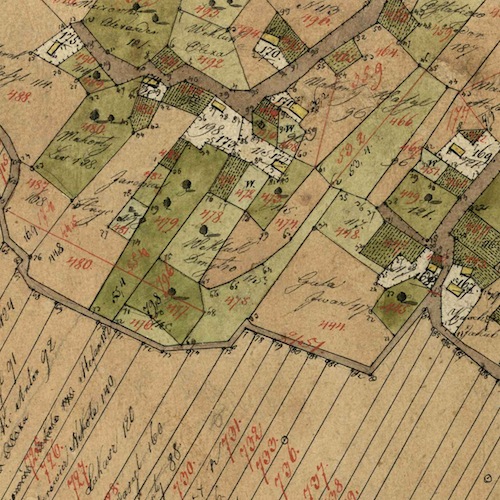
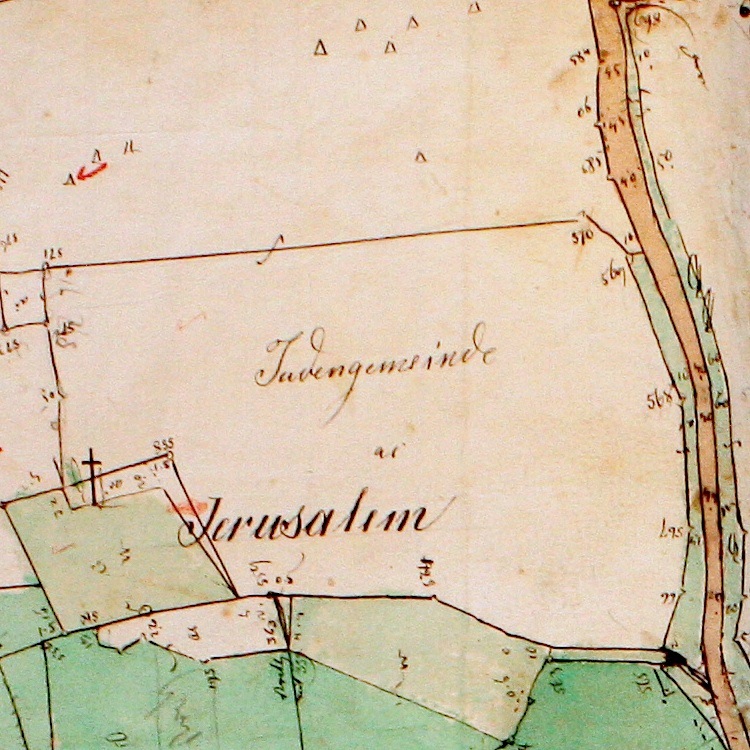
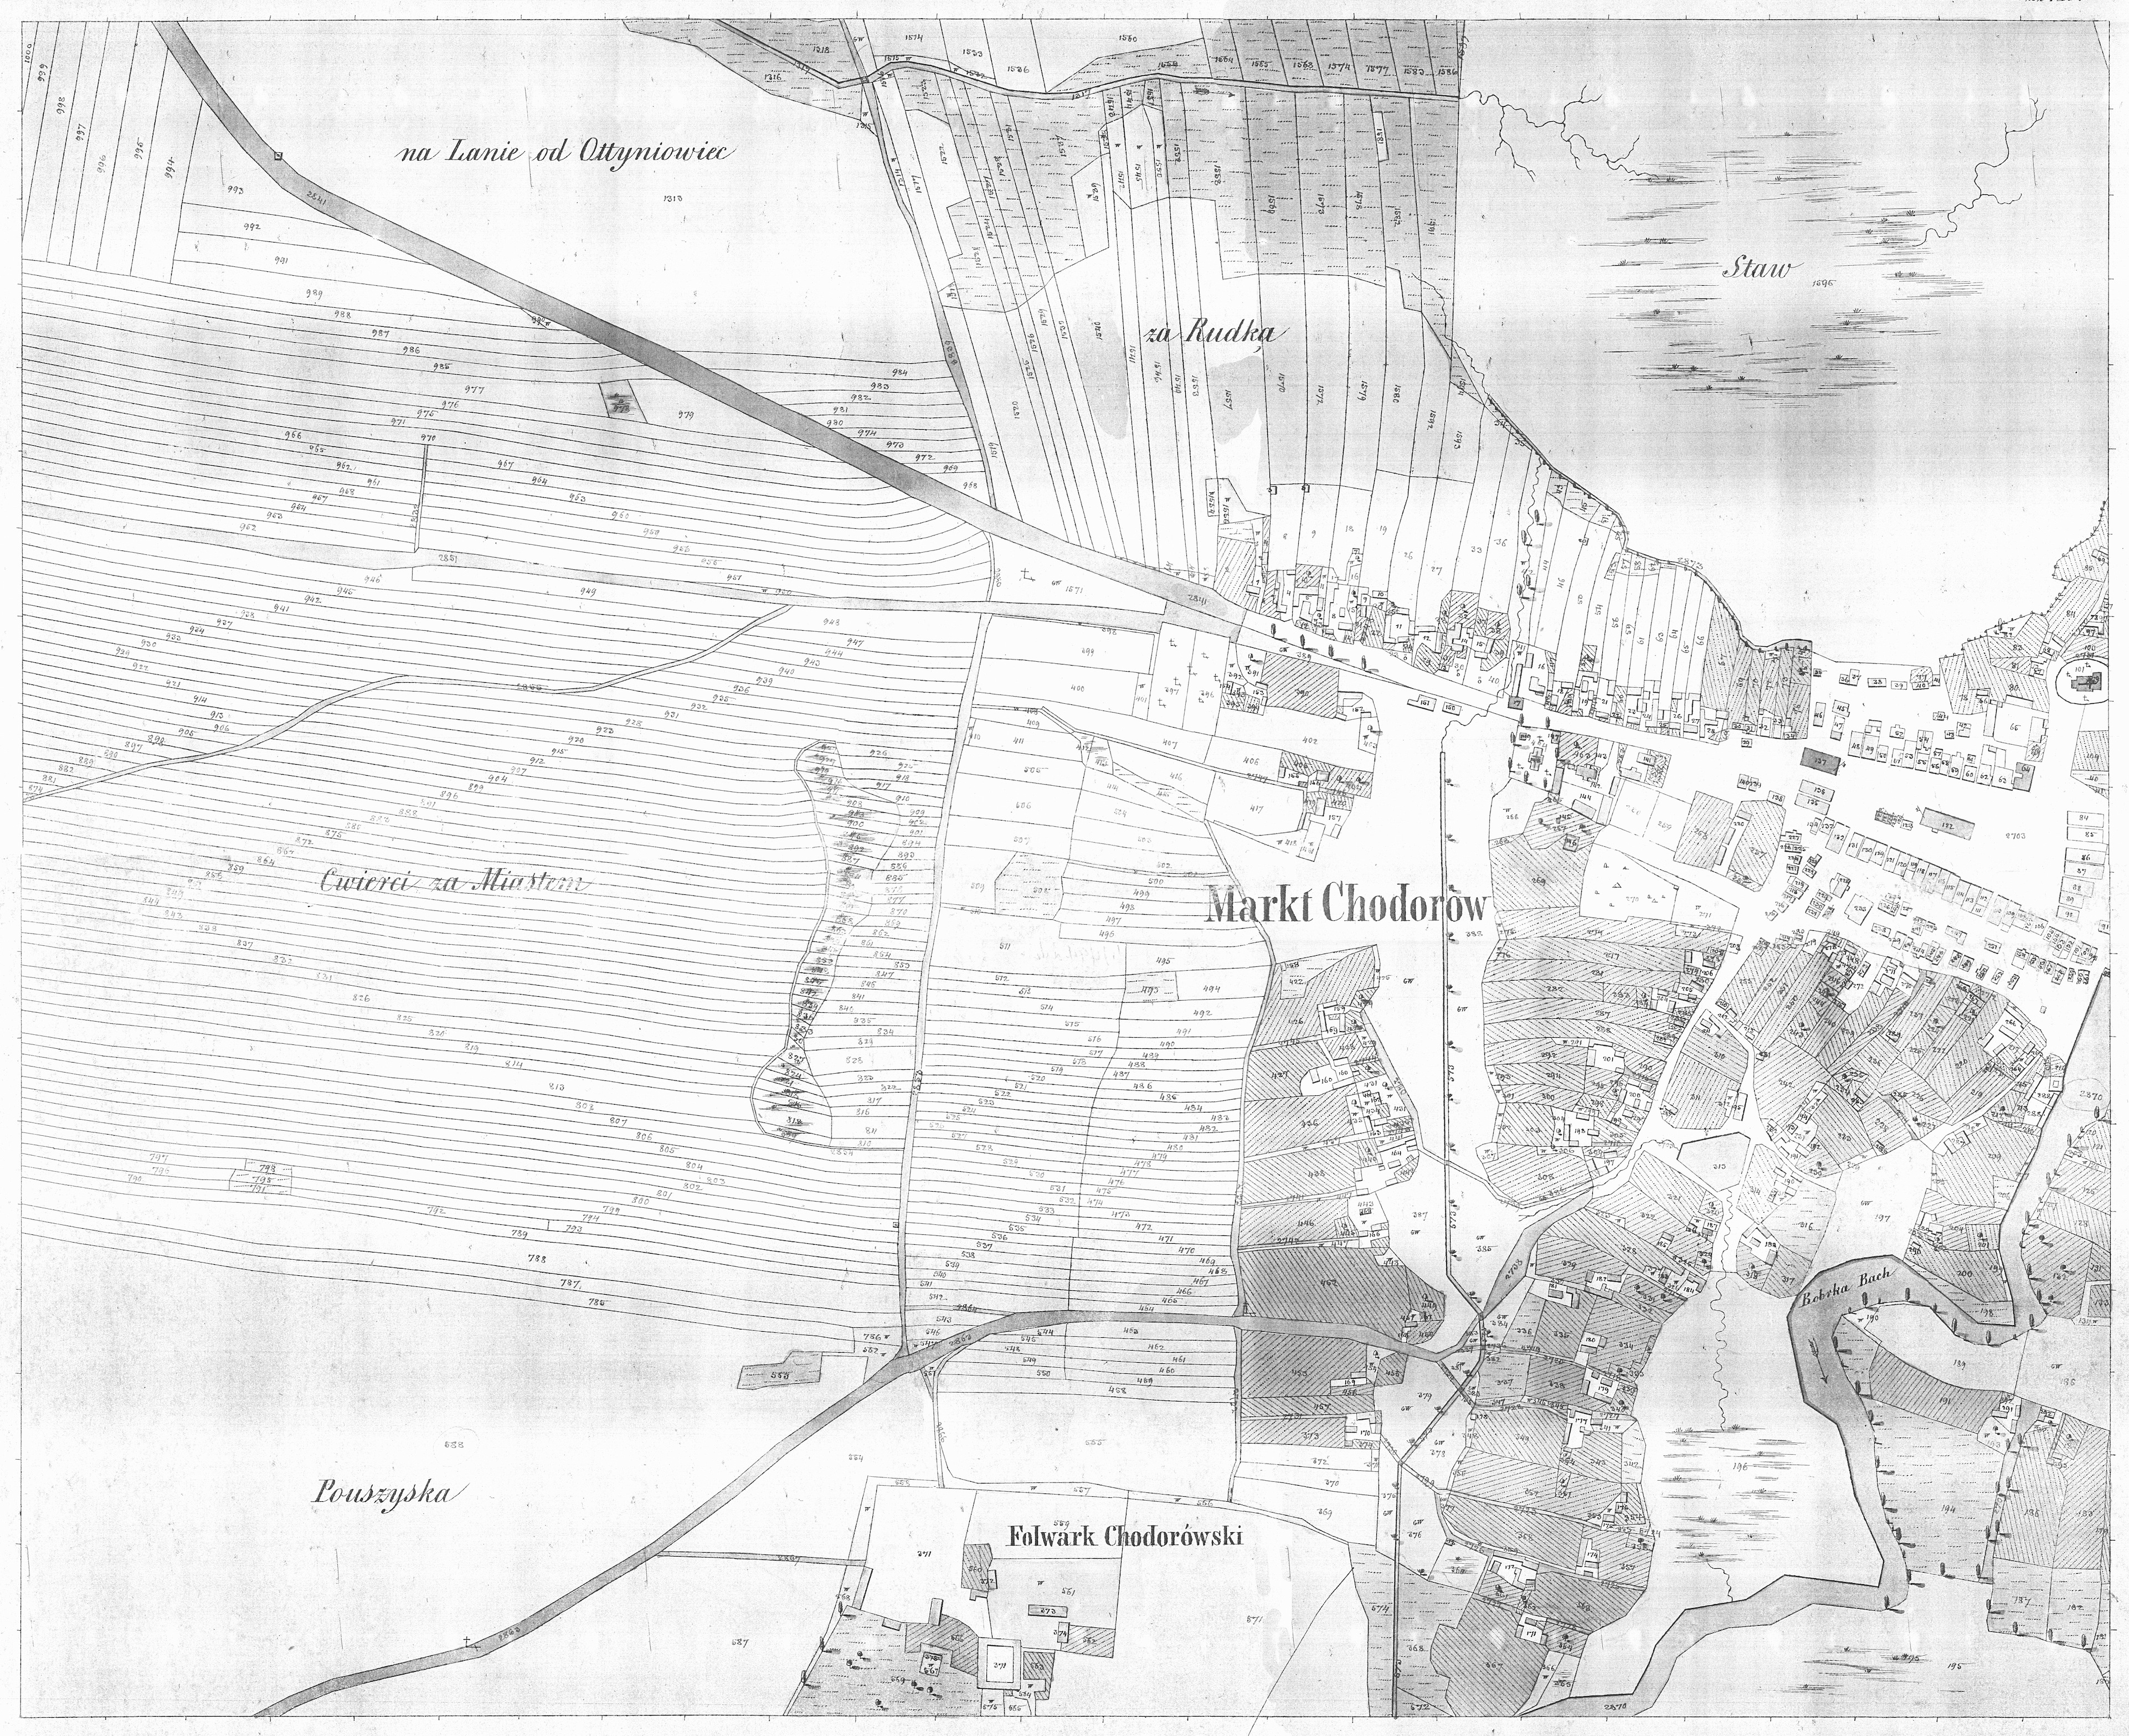
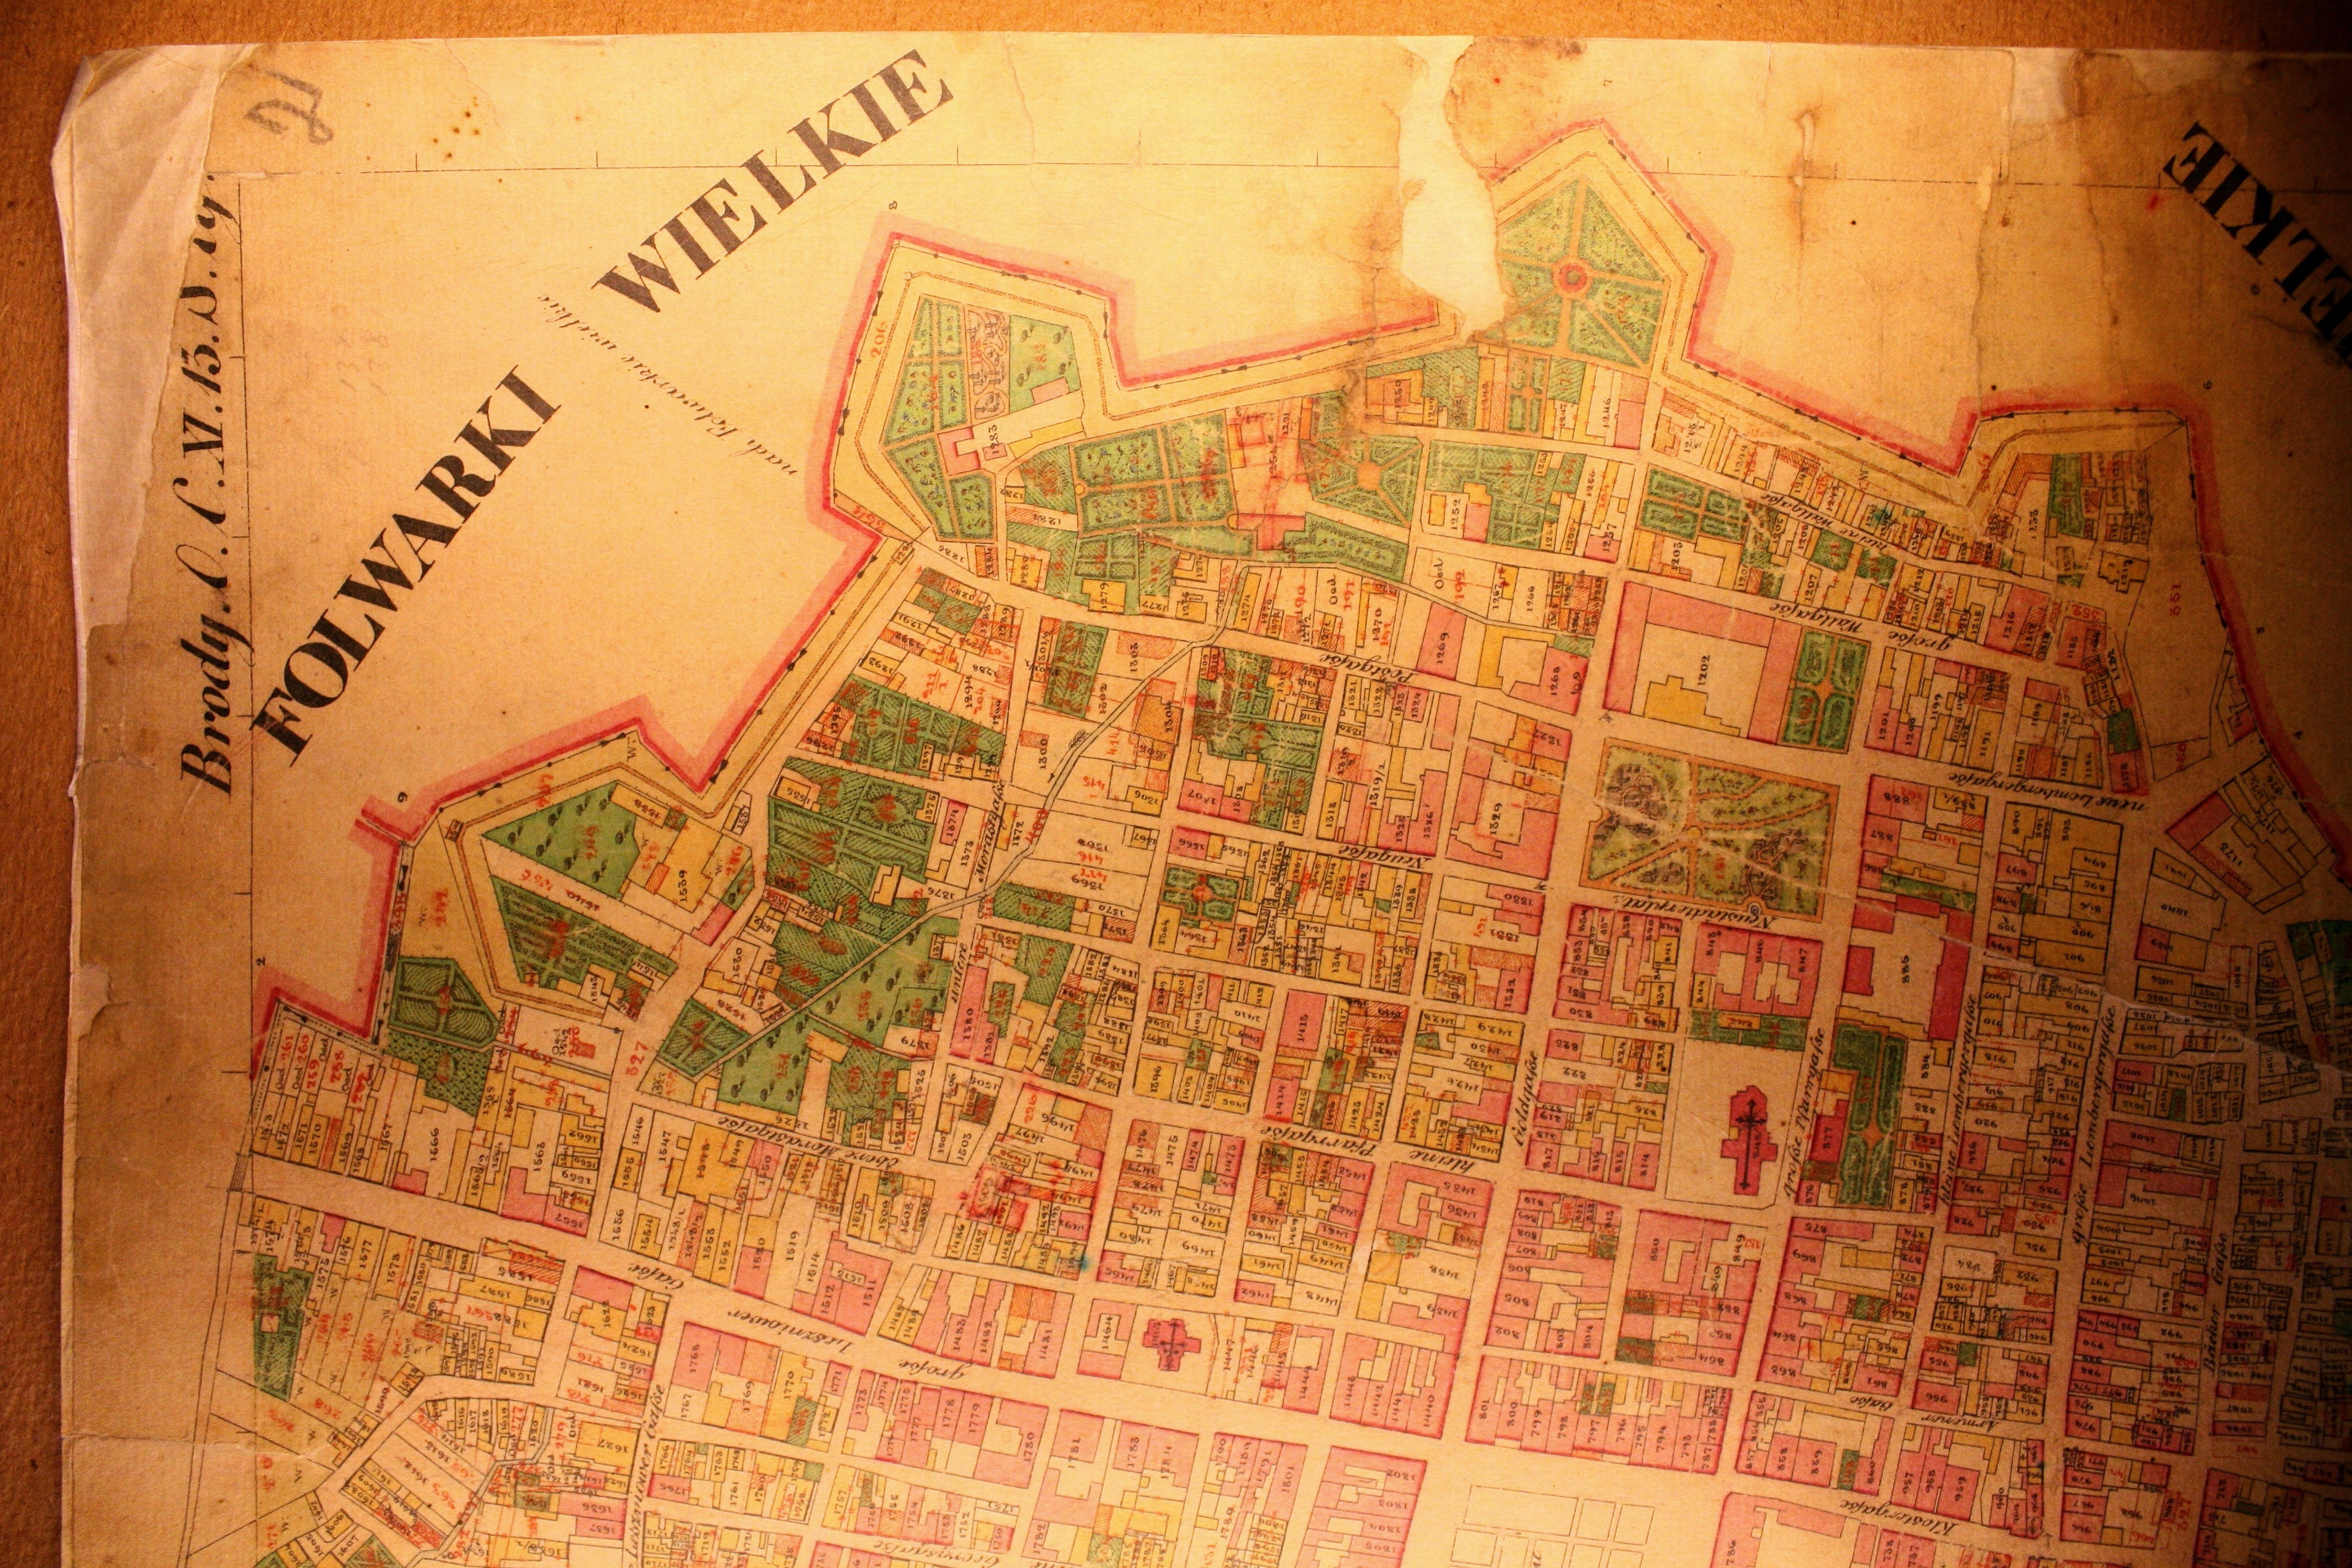
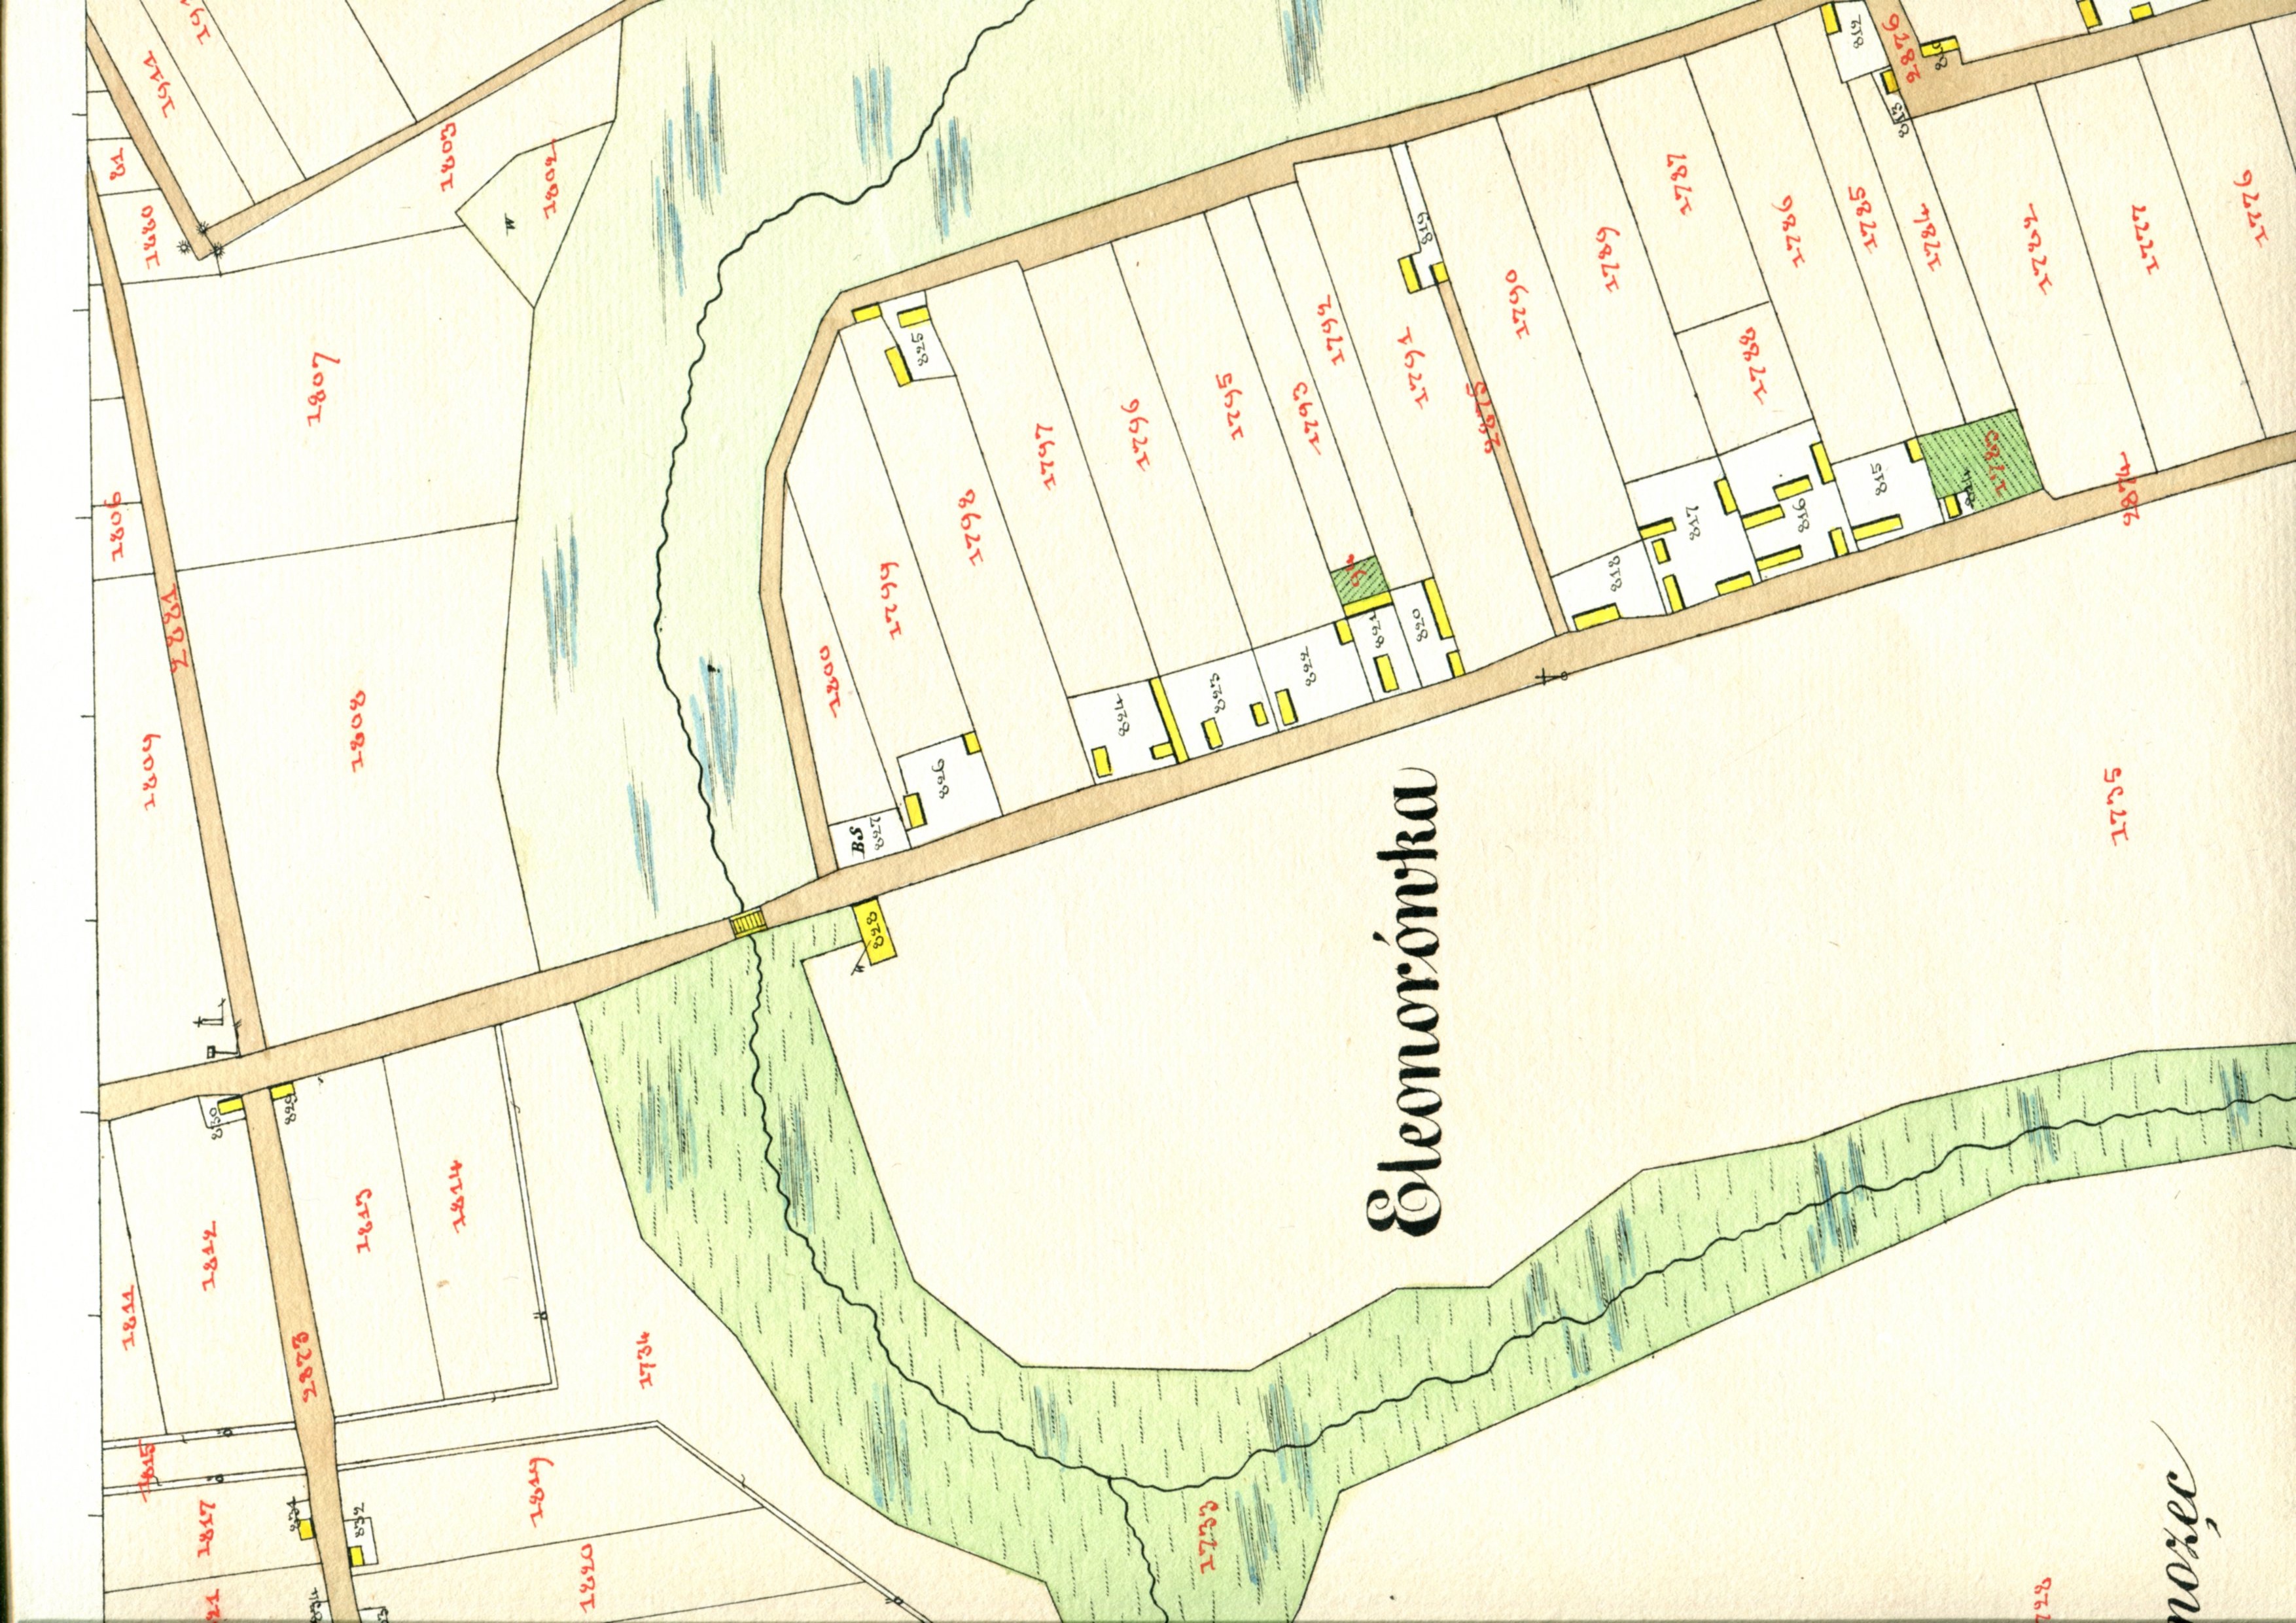
The creation of a cadastral map in the Austrian Empire progressed through several steps in each cadastral community, from field sketches used to record boundary and feature locations during the survey, through one or more intermediate steps, to a carefully drafted and lithographed final cadastral map. The original field sketches (Feldskizzen) were necessarily rough (though the quality varies considerably in the Gesher Galicia collection) and could be colored. Intermediate steps (Indikationsskizzen) were used to check and prepare for the final (usually) multi-color cadastral map (Katasterkarte). An example of each of these types of maps is shown here:

Many of the Austrian cadastral maps were produced at a common scale (1:2880, though there are examples at fractions and multiples of this scale depending on feature concentration), on paper sheets which typically measured about 20 by 25 inches (50 by 65 cm).
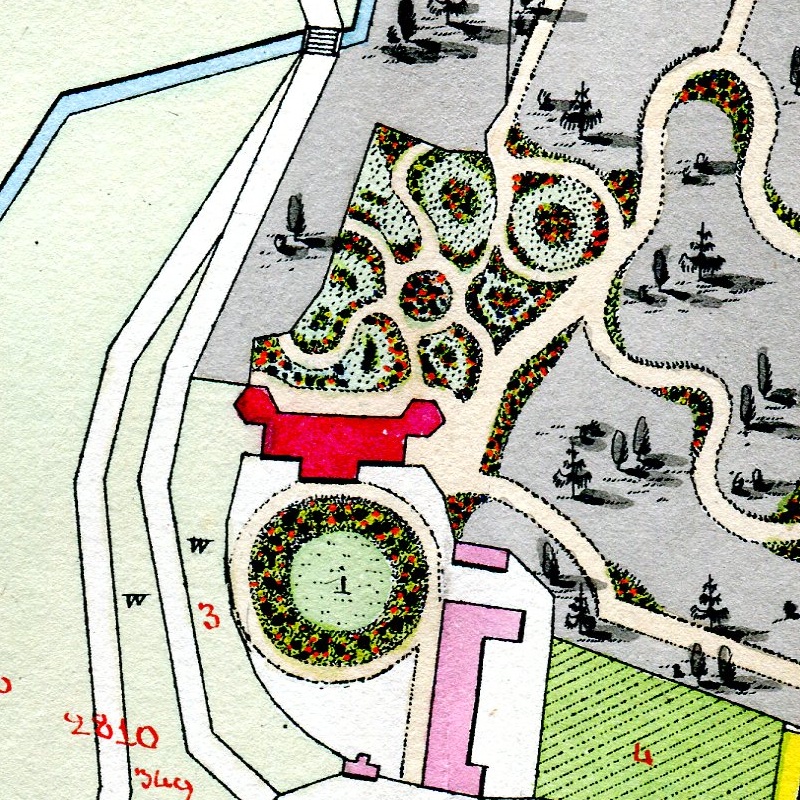
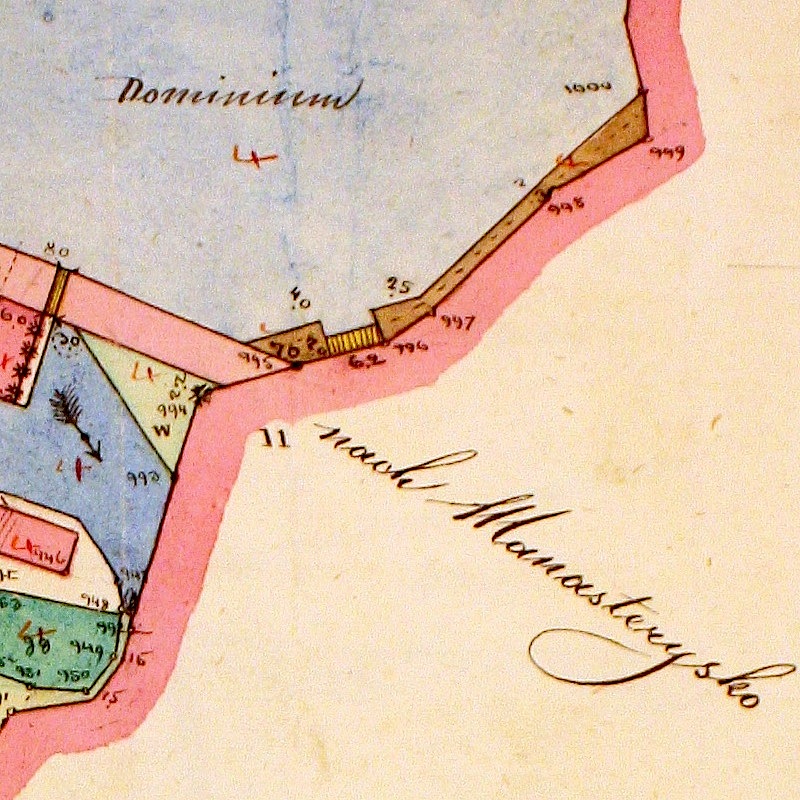
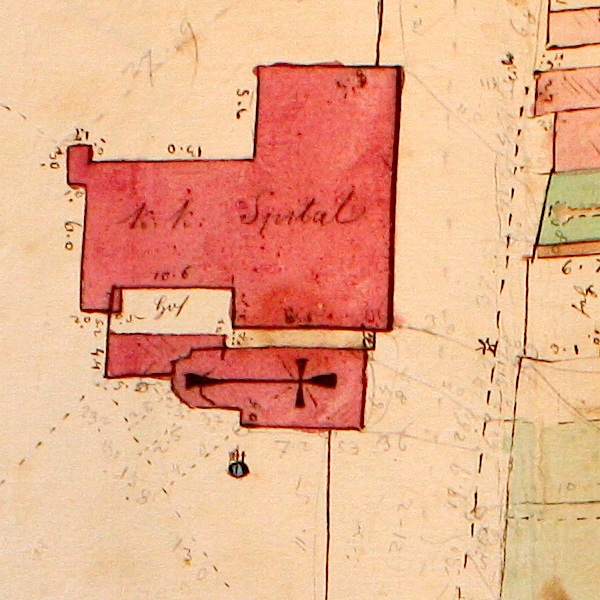
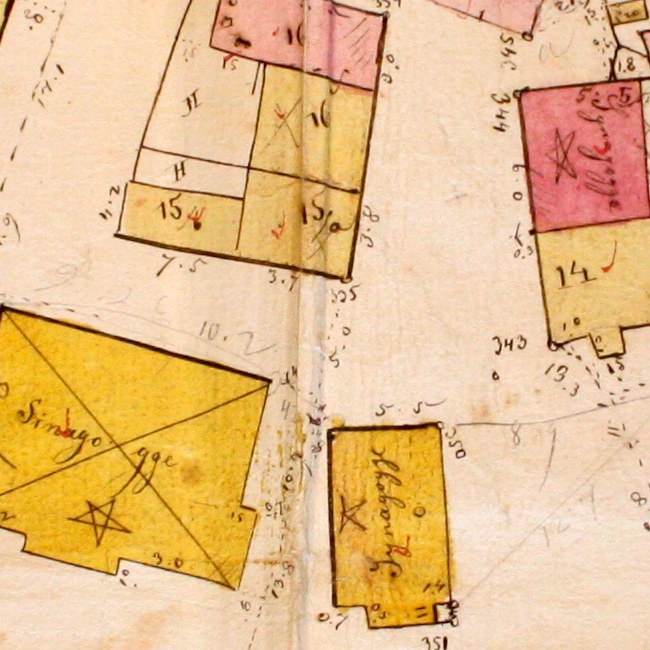
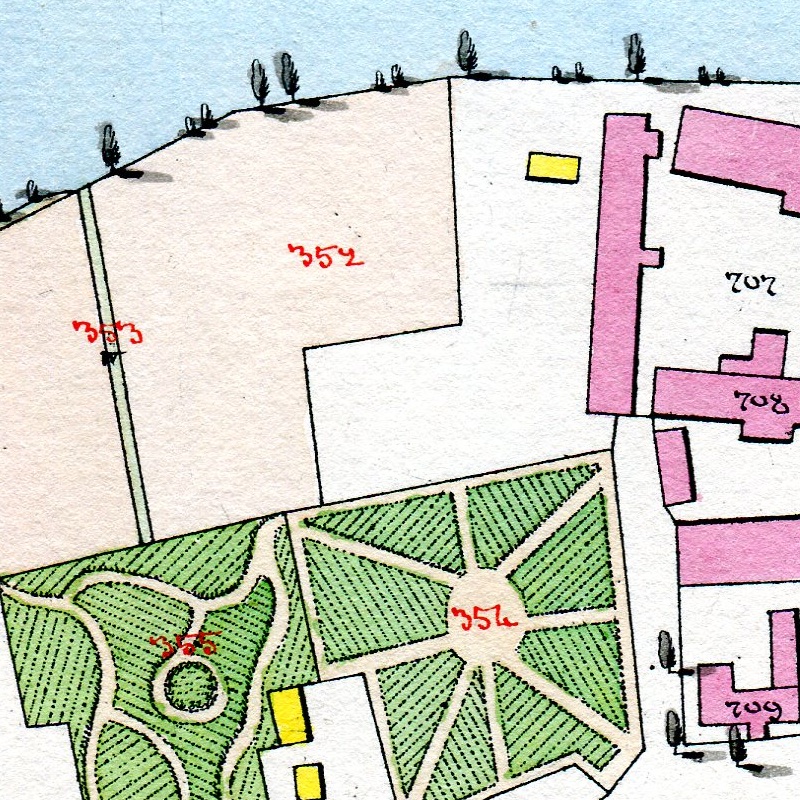
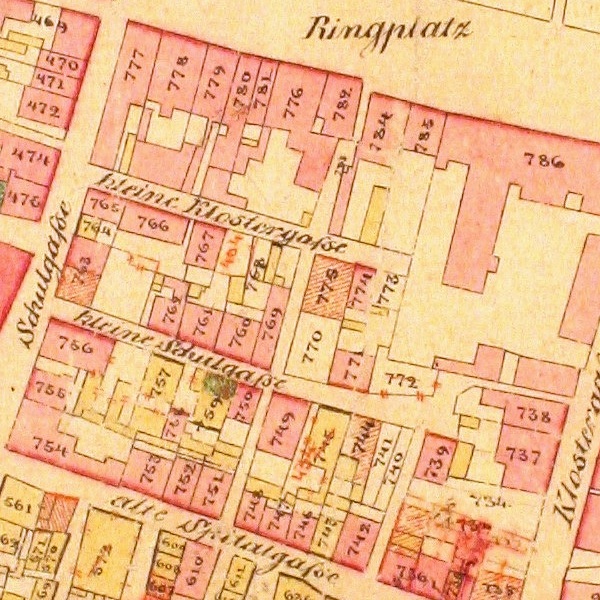
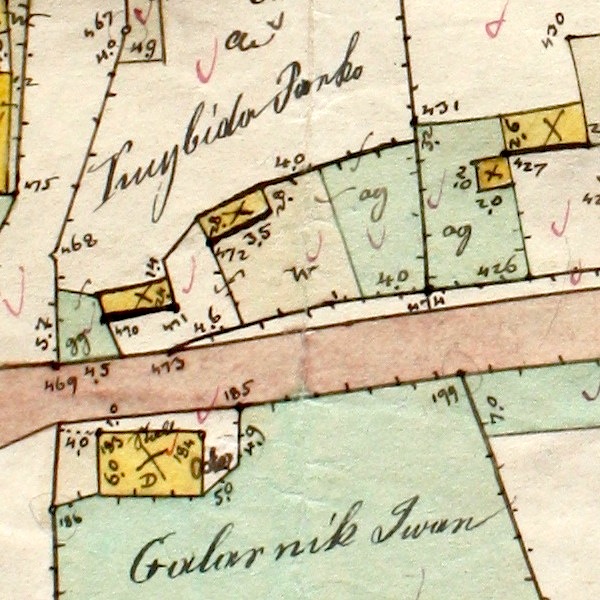
The maps show property (land and buildings) in the cadastral community, along with some other man-made features (roads, canals, bridges, orchards) and natural features (rivers, creeks, forests, waste land). Feldskizzen and Indikationsskizzen often have hand-written annotations giving the names of property owners and identifying land or buildings owned by religious communities (such as monasteries, cemeteries, hospitals, and synagogues). Names of roads were usually non-existent, though the directions of roads leaving towns (i.e. toward which adjacent town) are often given, and in rare cases street names in towns are included. Examples of these features are shown here:

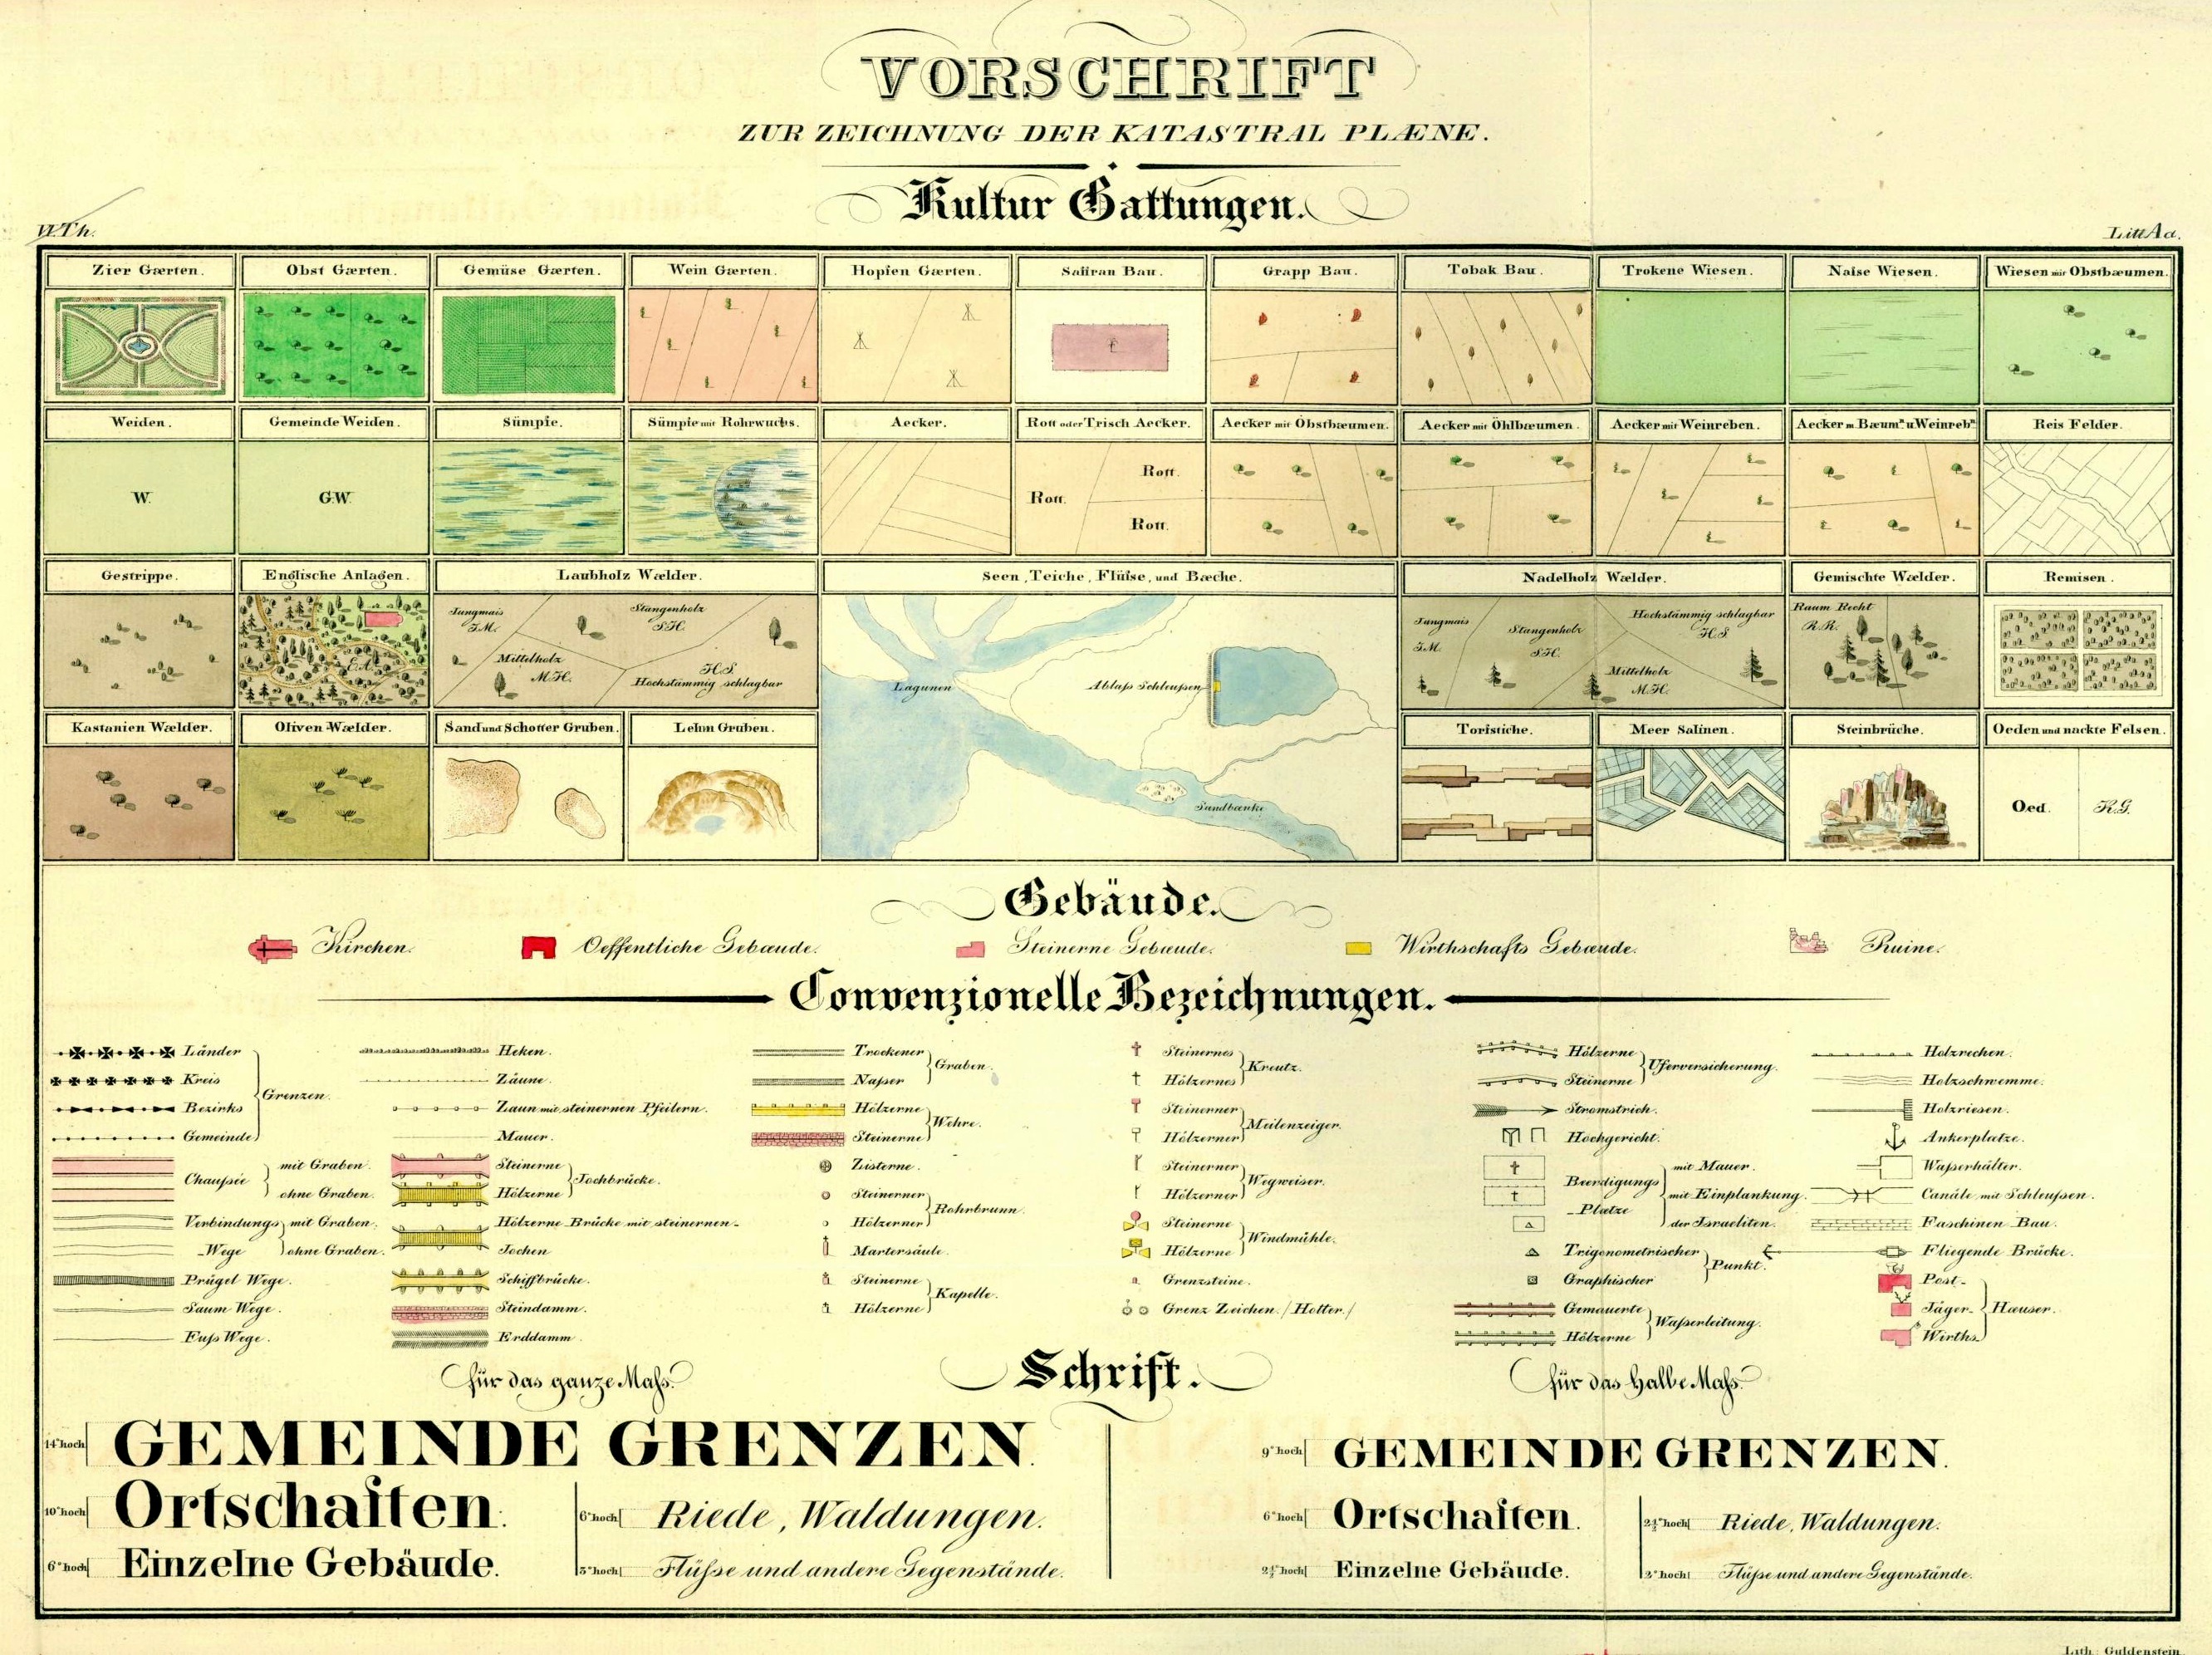
Most cadastral maps in the Empire referenced a common legend for land and building types; one example (in German) is shown here, alongside an English-annotated copy:

Apart from cadastral maps, other maps covering the region of Galicia and its towns and landscapes were produced in great variety for many purposes. Administrative maps aided the political hierarchy to manage the many levels of government; military maps served in defense of the borders; topographic maps served additional military and land-use purposes. A selection of political maps are presented in the Gesher Galicia Map Room; maps from other websites are listed in the Links page.
The military/topographic maps of the Austrian Empire are also significant because of their relationship to the cadastral map surveys described above. The first military survey was done during the reign of Empress Maria Theresa, and the mapping and rectification completed during the reign of Emperor Joseph II, in the 1760s thru 1780s; this map series was produced at 1:28,800 scale (quite detailed at the time), but without any geodetic control and with a minimum of measurements, typically sketched by visual estimates or a measurement table. The maps depicted points and features of value or suitable for military purposes: primary roads, rivers, and bridges (for transportation); churches, mills, and other large buildings (for stores and defense); arable fields, pastures, orchards, and forests (food and materials); and altitudes of key hills and slopes. Despite significant geographic inaccuracy, these maps later served as the initial reference base for the original cadastral maps of the Empire.
The low quality of the first military map series drove a second military survey effort, under Emperor Franz II/I in the 19th century. This series was based on a new trigonometric network of base points (used also for the cadastral maps), and in some cases on the cadastral maps themselves, which significantly improved accuracy. The series was again produced at 1:28,800 scale.
The third military mapping survey was initiated by order of Austrian Ministry of War in 1868, and took place before and during the first years of the first World War, starting in the years 1869 to 1887. Map sheets were produced at various scales, including Aufnahmeblätter at 1:25,000 and Spezialkarte 1:75,000. This Generalkarte von Mitteleuropa covered the extent of the Empire, plus surrounding European territories.
Besides providing clues to the evolution of the business environment in Galicia due to changes in transportation and shipping, maps of the developing rail network in the late 19th- and early 20th-century Austro-Hungarian Empire can provide an interesting link for genealogists for their families who emigrated from Galicia via ships to the Americas and elsewhere; the rail network would commonly have been how emigrating individuals and families traveled from their homes to ports on any of the nearest seas (Baltic, North, Black, Adriatic, or Mediterranean). Gesher Galicia has begun to link relevant rail network maps in the Map Room.
Original paper maps may be stored in the archives in a variety of formats (loose sheets, rolls, cut and cloth-backed for portability, large or compact bound books, etc.), with or without added color, with or without annotations made at the time the map was created or by later archivists. The variety of map formats creates some challenges for suitable capture and presentation of the maps.
After historic paper maps have been located in archives, researchers working for Gesher Galicia capture the maps digitally in one of several ways, depending on archive rules and permitted equipment. Some maps are photocopied ('xeroxed') onto large-format paper, then shipped to Gesher Galicia for digital scanning; these map images will appear in greyscale, usually with good detail and uniform scale. Other maps are digitally photographed using a high-quality compact digital camera, which produces a color image (unless the original paper map lacks color) with common camera distortion; to achieve good image resolution, typically each map sheet is divided into several separate but overlapping images; this approach is particularly good for bound maps, which cannot easily be flattened. Some maps have been scanned in the archives using a color flatbed scanner carried in by the researchers, which produces a low-distortion image of good resolution; sheets of these maps are also usually divided into sections, due to scanner size limitations for portability. A few examples of original digitized map sheets are shown here:

Some historic maps were drawn with careful reproduction of geographic area (final cadastral maps, military and topographic maps, etc.); however, in these maps a small mismatch of roads and parcel borders between map sheets is common. Unfortunately, the preliminary field sketches (feldskizzen) used by the cadastral surveyors to note their measurements of landmark locations are often the only maps surviving for Galician towns from the 19th century; these maps are usually very distorted with respect to the true landscape, and individual sheets from these maps often clash significantly in first attempts at alignment and assembly. Further, in the years after the creation of the maps, most of the sheets show signs of age-related distortion (from moisture absorption, folding, etc.). Then, additional distortion can be introduced in the digital capture process, especially when the images are produced by cameras.
To improve the fit of map features between sheets, each of the individual map sheets was digitally "rubbersheeted", locally distorting the map image to reduce camera and paper distortion, and to reduce mismatch between drawn features. Current and other historic maps of the region were used to guide assembly, but except for a few examples, no attempt was made to accurately align the historic maps with true geography; the relative location of genealogically-significant map features was considered most important in the assembly.
Rubbersheeting of each map sheet was done in Adobe Photoshop Elements (PSE), serving as a poor-man's GIS; for the most distorted maps, rubbersheeting included cutting the map sheet image into small recognizable blocks, then scaling, rotating, and distorting each block to better fit the target image. The small blocks were then merged (or "stitched") together to re-assemble the sheet, again in PSE. Except on sheets where no buildings were present, original image resolution was retained so that numbers and words remained legible in the stitched result. Usually, several map sheets were edited together as layers in a single file, as the limited number of redundant geographic features were scattered over the sheets, and juggling of the images was necessary to prevent clashes between buildings and landscape elements which were distant from known features; a conservative approach was taken (less significant distortion from the original map image) except where serious clashes were present. In preparation for assembling the entire map composite, the edges of individual sheets were trimmed (erased) in PSE so that waste area on each rectangular sheet did not overlap with useful image data on adjacent sheets; "holes" in the sheet image data were also filled in PSE by copying (clone stamping) from nearby map data. In rare cases, as a final adjustment, a color layer was added to the PSE file to help interpret areas where a 19th-century mapmaker omitted typical feature color-coding; for example, waterways which are inconsistently colored may be manually colored light blue so the path or water through a town can be more easily seen.
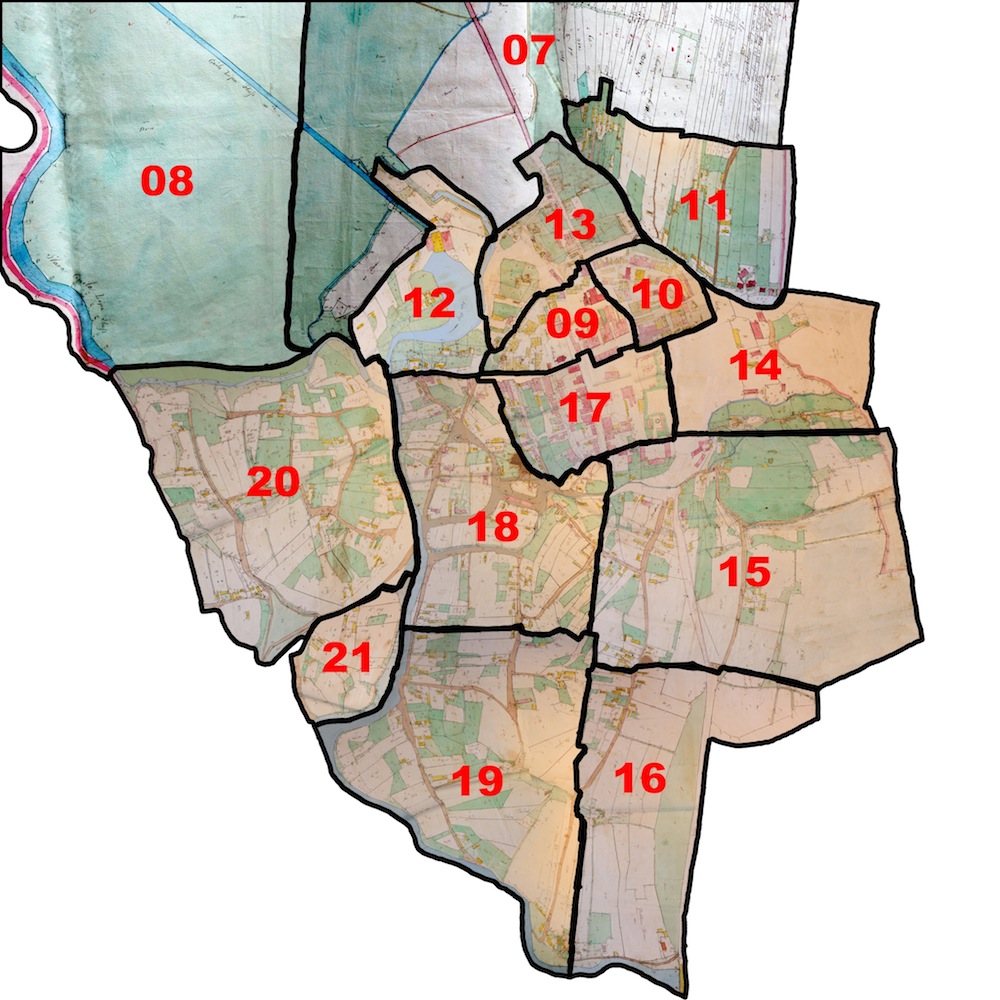
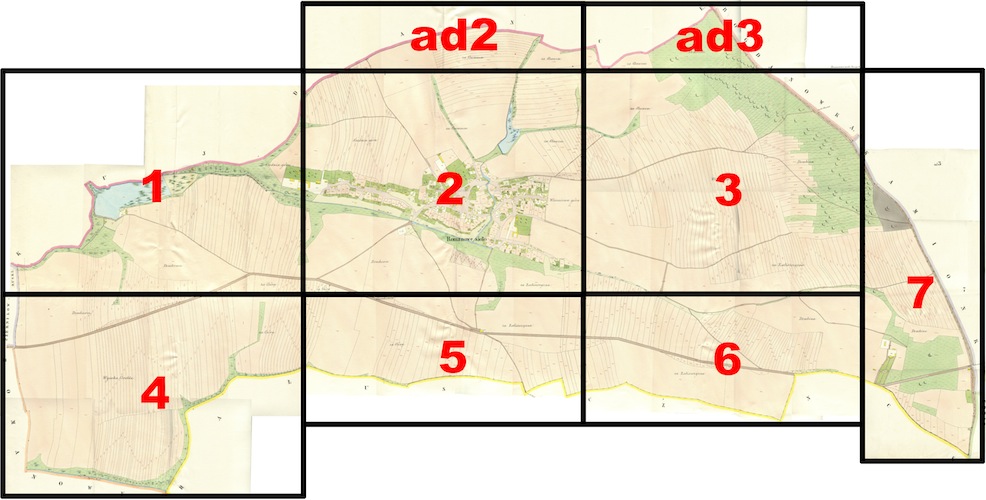
The individual revised sheets were then assembled into a single large composite image, again using PSE in a process of edge blending and correction, within the limits of PSE file size restrictions and computer memory space; to preserve legibility of notations, some final composite maps here exceed 250 megapixels total. This second composite became the basis for the online map; the image size is 16384 x 16384 pixels (a convenient count for map tiling), or just over 250 megapixels total. Although topographic and cadastral maps appear very rectangular in their final fit, the individual sheets of feldskizzen usually fit more like a puzzle. An index of the final composite of 15 sheets from the 1846 feldskizzen of Rohatyn is shown here as an example; next to it is an index of the 9 sheets of the 1862 cadastral map of Romanowe Sioło.
Browser-based land maps (Google, Yahoo, Bing, etc.) typically use tiling of map images to allow zooming at great depth without requiring the browser to load huge amounts of graphic data. The free program MapTiler was used to cut and index the map tiles for presentation in browser mapping applications; MapTiler is a GUI to the open-source GDAL set of map utilities. MapTiler also provides a basic map viewer for the OpenLayers API, which was adapted for the Gesher Galicia Map Room.
Several experimental maps have been created in shared mapping projects between Gesher Galicia and the Rohatyn Shtetl Research Group, to bring additional research tools to genealogists working in the area. Two key examples are shown here:
See also the Links section of the Map Room for other map sources and information.